 Multiple Exceptions (user mode) - Modeling Example
 Multiple Exceptions (kernel mode)
 Multiple Exceptions (managed space)
- Multiple Exceptions (stowed)
 Dynamic Memory Corruption (process heap)
 Dynamic Memory Corruption (kernel pool)
- Dynamic Memory Corruption (managed heap)
 False Positive Dump
 Lateral Damage (general)
- Lateral Damage (CPU mode)
 Optimized Code (function parameter reuse)
 Invalid Pointer (general)
- Invalid Pointer (objects)
 NULL Pointer (code)
 NULL Pointer (data)
 Inconsistent Dump
 Hidden Exception (user space)
- Hidden Exception (kernel space)
- Hidden Exception (managed space)
 Deadlock (critical sections)
 Deadlock (executive resources)
 Deadlock (mixed objects, user space)
 Deadlock (LPC)
 Deadlock (mixed objects, kernel space)
 Deadlock (self)
- Deadlock (managed space)
- Deadlock (.NET Finalizer)
 Changed Environment
 Incorrect Stack Trace
 OMAP Code Optimization
 No Component Symbols
 Insufficient Memory (committed memory)
 Insufficient Memory (handle leak)
 Insufficient Memory (kernel pool)
 Insufficient Memory (PTE)
 Insufficient Memory (module fragmentation)
 Insufficient Memory (physical memory)
 Insufficient Memory (control blocks)
- Insufficient Memory (reserved virtual memory)
- Insufficient Memory (session pool)
- Insufficient Memory (stack trace database)
- Insufficient Memory (region)
- Insufficient Memory (stack)
 Spiking Thread
 Module Variety
 Stack Overflow (kernel mode)
 Stack Overflow (user mode)
 Stack Overflow (software implementation)
- Stack Overflow (insufficient memory)
- Stack Overflow (managed space)
 Managed Code Exception
- Managed Code Exception (Scala)
- Managed Code Exception (Python)
 Truncated Dump
 Waiting Thread Time (kernel dumps)
 Waiting Thread Time (user dumps)
 Memory Leak (process heap) - Modeling Example
 Memory Leak (.NET heap)
- Memory Leak (page tables)
- Memory Leak (I/O completion packets)
- Memory Leak (regions)
 Missing Thread (user space)
- Missing Thread (kernel space)
 Unknown Component
 Double Free (process heap)
 Double Free (kernel pool)
 Coincidental Symbolic Information
 Stack Trace
- Stack Trace (I/O request)
- Stack Trace (file system filters)
- Stack Trace (database)
- Stack Trace (I/O devices)
 Virtualized Process (WOW64)
- Virtualized Process (ARM64EC and CHPE)
 Stack Trace Collection (unmanaged space)
- Stack Trace Collection (managed space)
- Stack Trace Collection (predicate)
- Stack Trace Collection (I/O requests)
- Stack Trace Collection (CPUs)
 Coupled Processes (strong)
 Coupled Processes (weak)
 Coupled Processes (semantics)
 High Contention (executive resources)
 High Contention (critical sections)
 High Contention (processors)
- High Contention (.NET CLR monitors)
- High Contention (.NET heap)
- High Contention (sockets)
 Accidental Lock
 Passive Thread (user space)
 Passive System Thread (kernel space)
 Main Thread
 Busy System
 Historical Information
 Object Distribution Anomaly (IRP)
- Object Distribution Anomaly (.NET heap)
 Local Buffer Overflow (user space)
- Local Buffer Overflow (kernel space)
 Early Crash Dump
 Hooked Functions (user space)
 Hooked Functions (kernel space)
- Hooked Modules
 Custom Exception Handler (user space)
 Custom Exception Handler (kernel space)
 Special Stack Trace
 Manual Dump (kernel)
 Manual Dump (process)
 Wait Chain (general)
 Wait Chain (critical sections)
 Wait Chain (executive resources)
 Wait Chain (thread objects)
 Wait Chain (LPC/ALPC)
 Wait Chain (process objects)
 Wait Chain (RPC)
 Wait Chain (window messaging)
 Wait Chain (named pipes)
- Wait Chain (mutex objects)
- Wait Chain (pushlocks)
- Wait Chain (CLR monitors)
- Wait Chain (RTL_RESOURCE)
- Wait Chain (modules)
- Wait Chain (nonstandard synchronization)
- Wait Chain (C++11, condition variable)
- Wait Chain (SRW lock)
 Corrupt Dump
 Dispatch Level Spin
 No Process Dumps
 No System Dumps
 Suspended Thread
 Special Process
 Frame Pointer Omission
 False Function Parameters
 Message Box
 Self-Dump
 Blocked Thread (software)
 Blocked Thread (hardware)
- Blocked Thread (timeout)
 Zombie Processes
 Wild Pointer
 Wild Code
 Hardware Error
 Handle Limit (GDI, kernel space)
- Handle Limit (GDI, user space)
 Missing Component (general)
 Missing Component (static linking, user mode)
 Execution Residue (unmanaged space, user)
- Execution Residue (unmanaged space, kernel)
- Execution Residue (managed space)
 Optimized VM Layout
- Invalid Handle (general)
- Invalid Handle (managed space)
- Overaged System
- Thread Starvation (realtime priority)
- Thread Starvation (normal priority)
- Duplicated Module
- Not My Version (software)
- Not My Version (hardware)
- Data Contents Locality
- Nested Exceptions (unmanaged code)
- Nested Exceptions (managed code)
- Affine Thread
- Self-Diagnosis (user mode)
- Self-Diagnosis (kernel mode)
- Self-Diagnosis (registry)
- Inline Function Optimization (unmanaged code)
- Inline Function Optimization (managed code)
- Critical Section Corruption
- Lost Opportunity
- Young System
- Last Error Collection
- Hidden Module
- Data Alignment (page boundary)
- C++ Exception
- Divide by Zero (user mode)
- Divide by Zero (kernel mode)
- Swarm of Shared Locks
- Process Factory
- Paged Out Data
- Semantic Split
- Pass Through Function
- JIT Code (.NET)
- JIT Code (Java)
- Ubiquitous Component (user space)
- Ubiquitous Component (kernel space)
- Nested Offender
- Virtualized System
- Effect Component
- Well-Tested Function
- Mixed Exception
- Random Object
- Missing Process
- Platform-Specific Debugger
- Value Deviation (stack trace)
- Value Deviation (structure field)
- Runtime Thread (CLR)
- Runtime Thread (Python, Linux)
- Coincidental Frames
- Fault Context
- Hardware Activity
- Incorrect Symbolic Information
- Message Hooks - Modeling Example
- Coupled Machines
- Abridged Dump
- Exception Stack Trace
- Distributed Spike
- Instrumentation Information
- Template Module
- Invalid Exception Information
- Shared Buffer Overwrite
- Pervasive System
- Problem Exception Handler
- Same Vendor
- Crash Signature
- Blocked Queue (LPC/ALPC)
- Fat Process Dump
- Invalid Parameter (process heap)
- Invalid Parameter (runtime function)
- String Parameter
- Well-Tested Module
- Embedded Comment
- Hooking Level
- Blocking Module
- Dual Stack Trace
- Environment Hint
- Top Module
- Livelock
- Technology-Specific Subtrace (COM interface invocation)
- Technology-Specific Subtrace (dynamic memory)
- Technology-Specific Subtrace (JIT .NET code)
- Technology-Specific Subtrace (COM client call)
- Dialog Box
- Instrumentation Side Effect
- Semantic Structure (PID.TID)
- Directing Module
- Least Common Frame
- Truncated Stack Trace
- Data Correlation (function parameters)
- Data Correlation (CPU times)
- Module Hint
- Version-Specific Extension
- Cloud Environment
- No Data Types
- Managed Stack Trace
- Managed Stack Trace (Scala)
- Managed Stack Trace (Python)
- Coupled Modules
- Thread Age
- Unsynchronized Dumps
- Pleiades
- Quiet Dump
- Blocking File
- Problem Vocabulary
- Activation Context
- Stack Trace Set
- Double IRP Completion
- Caller-n-Callee
- Annotated Disassembly (JIT .NET code)
- Annotated Disassembly (unmanaged code)
- Handled Exception (user space)
- Handled Exception (.NET CLR)
- Handled Exception (kernel space)
- Duplicate Extension
- Special Thread (.NET CLR)
- Hidden Parameter
- FPU Exception
- Module Variable
- System Object
- Value References
- Debugger Bug
- Empty Stack Trace
- Problem Module
- Disconnected Network Adapter
- Network Packet Buildup
- Unrecognizable Symbolic Information
- Translated Exception
- Regular Data
- Late Crash Dump
- Blocked DPC
- Coincidental Error Code
- Punctuated Memory Leak
- No Current Thread
- Value Adding Process
- Activity Resonance
- Stored Exception
- Spike Interval
- Stack Trace Change
- Unloaded Module
- Deviant Module
- Paratext
- Incomplete Session
- Error Reporting Fault
- First Fault Stack Trace
- Frozen Process
- Disk Packet Buildup
- Hidden Process
- Active Thread (Mac OS X)
- Active Thread (Windows)
- Critical Stack Trace
- Handle Leak
- Module Collection
- Module Collection (predicate)
- Deviant Token
- Step Dumps
- Broken Link
- Debugger Omission
- Glued Stack Trace
- Reduced Symbolic Information
- Injected Symbols
- Distributed Wait Chain
- One-Thread Process
- Module Product Process
- Crash Signature Invariant
- Small Value
- Shared Structure
- Thread Cluster
- False Effective Address
- Screwbolt Wait Chain
- Design Value
- Hidden IRP
- Tampered Dump
- Memory Fluctuation (process heap)
- Last Object
- Rough Stack Trace (unmanaged space)
- Rough Stack Trace (managed space)
- Past Stack Trace
- Ghost Thread
- Dry Weight
- Exception Module
- Reference Leak
- Origin Module
- Hidden Call
- Corrupt Structure
- Software Exception
- Crashed Process
- Variable Subtrace
- User Space Evidence
- Internal Stack Trace
- Distributed Exception (managed code)
- Thread Poset
- Stack Trace Surface
- Hidden Stack Trace
- Evental Dumps
- Clone Dump
- Parameter Flow
- Critical Region
- Diachronic Module
- Constant Subtrace
- Not My Thread
- Window Hint
- Place Trace
- Stack Trace Signature
- Relative Memory Leak
- Quotient Stack Trace
- Module Stack Trace
- Foreign Module Frame
- Unified Stack Trace
- Mirror Dump Set
- Memory Fibration
- Aggregated Frames
- Frame Regularity
- Stack Trace Motif
- System Call
- Stack Trace Race
- Hyperdump
- Disassembly Ambiguity
- Exception Reporting Thread
- Active Space
- Subsystem Modules
- Region Profile
- Region Clusters
- Source Stack Trace
- Hidden Stack
- Interrupt Stack
- False Memory
- Frame Trace
- Pointer Cone
- Context Pointer
- Pointer Class
- False Frame
- Procedure Call Chain
- C++ Object
- COM Exception
- Structure Sheaf
- Saved Exception Context (.NET)
- Shared Thread
- Spiking Interrupts
- Structure Field Collection
- Black Box
- Rough Stack Trace Collection (unmanaged space)
- COM Object
- Shared Page
- Exception Collection
- Dereference Nearpoint
- Address Representations
- Near Exception
- Shadow Stack Trace
- Past Process
- Foreign Stack
- Annotated Stack Trace
- Disassembly Summary
- Region Summary
- Analysis Summary
- Region Spectrum
- Normalized Region
- Function Pointer
- Interrupt Stack Collection
- DPC Stack Collection
- Dump Context
- False Local Address
- Encoded Pointer
- Latent Structure
- ISA-Specific Code
Structural and Behavioral Patterns for Diagnostics, Anomaly Detection, Forensics, Prognostics, Root Cause Analysis, Debugging
Our tools are only as good as our pattern language.
Analysis patterns for the quality of software diagnostics and observability in endpoint devices, enterprise and cloud environments, AI/ML systems and agentic AI.
Diagnostics Science
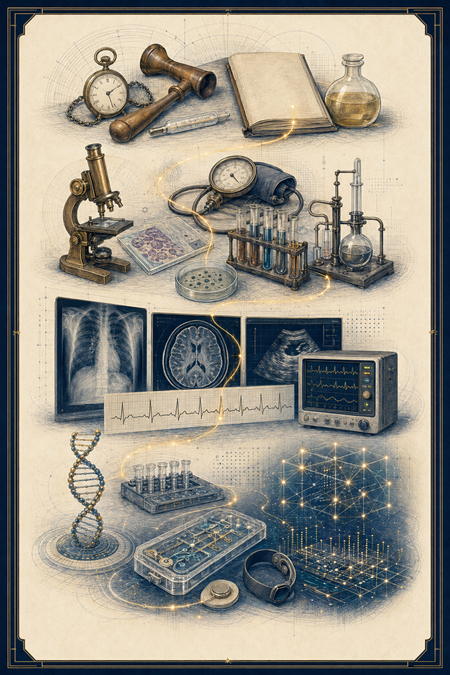
Diagnostics is the mother of problem solving.
All areas of human activity involve the use of diagnostics. Proper diagnostics identifies the right problems to solve. We are now a part of a non-profit organization dedicated to the developing and promoting the application of such diagnostics: systemic and pattern-oriented (pattern-driven and pattern-based).
The Software Diagnostics and Anomaly Detection Group
Please join LinkedIn The Software Diagnostics and Anomaly Detection Group.
History of ML and AI Diagnostics, Observability, and Debugging
From residuals, validation sets, and reasoning traces to model monitoring, mechanistic interpretability, foundation-model evaluation, and agentic observability

PDF: https://www.dumpanalysis.org/files/History_of_ML_and_AI_Diagnostics_Obse...
History of Medical Diagnostics, Observability, and Debugging
From bedside signs, pulse, and urine inspection to laboratory medicine, medical imaging, molecular testing, continuous monitoring, and AI-assisted diagnosis
PDF: https://www.dumpanalysis.org/files/History_of_Medical_Diagnostics_Observ...
History of Hardware Diagnostics, Observability, and Debugging
From sensory inspection, checking circuits, and test points to built-in self-test, remote management, digital twins, and AI-assisted fault isolation

PDF: https://www.dumpanalysis.org/files/History_of_Hardware_Diagnostics_Obser...
History of Software Diagnostics, Observability, and Debugging
From machine fault finding and post-mortem dumps to distributed telemetry, time-travel debugging, and AI-assisted root-cause analysis
PDF: https://www.dumpanalysis.org/files/History_of_Software_Diagnostics_Obser...
Twenty-One Grammars of Diagnostic Evidence
Memory Dumps, Traces, and Logs through Chinese, Korean, Japanese, Arabic, Sanskrit, Russian, German, Irish, French, Classical Greek, Latin, Southern Quechua, Swahili, Turkish, Māori, Cherokee, Tibetan, Tamil, Ancient Egyptian, Basque, and Udmurt

PDF: https://www.dumpanalysis.org/files/Twenty-One-Grammars-Diagnostic-Eviden...
Seven-Layer Observability Design Model: Based on an OSI Analogy
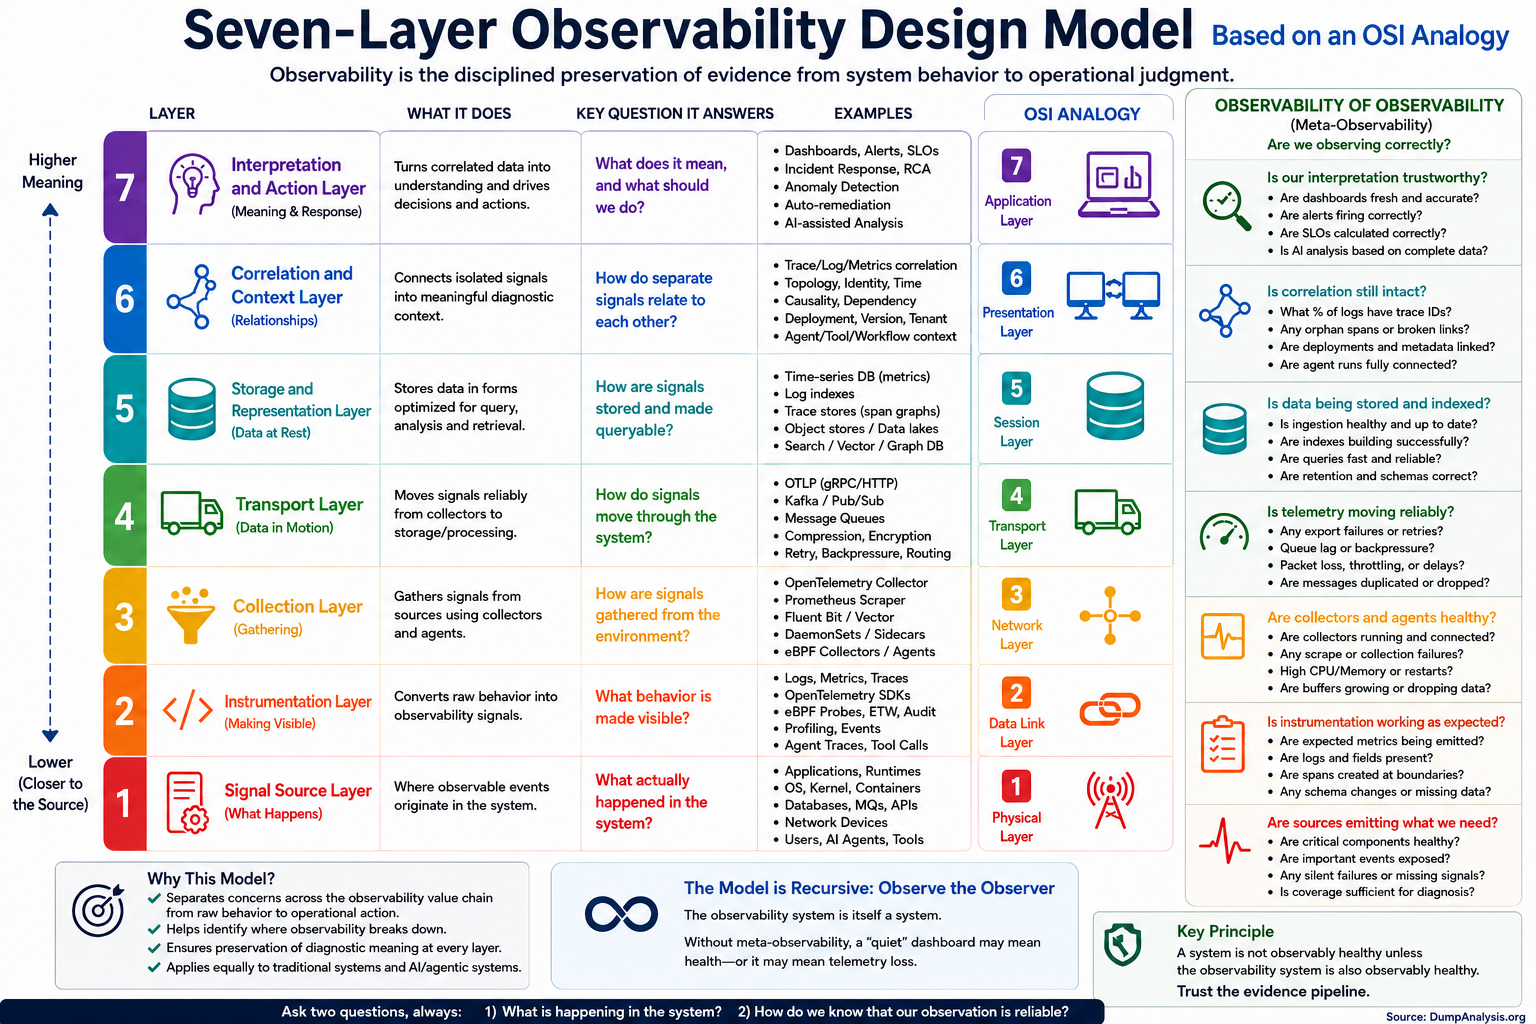
The Seven-Layer Observability Design Model is a conceptual framework for designing observability in modern software systems, modeled on the OSI networking model. It does not claim that observability literally has the same layers as networking. Instead, it uses the OSI-style layered thinking to separate concerns, clarify responsibilities, and make observability systems easier to reason about, build, debug, and evolve.
Layer 1: Signal Source Layer - the lowest layer of the model. It corresponds to where observable events originate.
Layer 2: Instrumentation Layer - turns raw system behavior into explicit observability signals.
Layer 3: Collection Layer - gathers observability signals from different sources.
Layer 4: Transport Layer - moves observability data from collectors to processing and storage systems.
Layer 5: Storage and Representation Layer - stores observability data in forms suitable for retrieval, querying, correlation, and analysis.
Layer 6: Correlation and Context Layer - connects isolated signals into meaningful diagnostic structures.
Layer 7: Interpretation and Action Layer - converts observability data into understanding and response.
Meta-observability: Observability of Observability - A production observability stack should itself be observable across the same seven layers.
Training: Advanced Linux Core Dump Analysis with Data Structures and Generative AI
Software Diagnostics Services organizes this online training course.

Learn how to navigate the process and kernel core memory dump space, and use Linux data structures to diagnose, troubleshoot, and debug complex software incidents. The training uses a unique, innovative pattern-oriented analysis approach to accelerate learning. It consists of practical step-by-step exercises using GDB and the Linux kernel crash utility. Additional topics include kernel structures navigation, practical scripting, kernel modules, drivers, and files. The training builds on the bestselling Accelerated Linux Core Dump Analysis and includes a crash course in essential C for the Linux kernel and a relevant Unified Modeling Language tutorial. The course also covers Generative AI to aid and automate core dump analysis and visualization.
To avoid repeating some topics and save time, the training includes the Accelerated Linux Core Dump Analysis PDF book.
You get:
- Accelerated Linux Core Dump Analysis PDF book
- Full slides
- Training sessions recording
- Personalized Certificate with unique CID
- The course PDF book (available later this year)
Prerequisites:
Basic and intermediate level Linux core dump analysis: the ability to list tasks, threads, libraries, modules, apply symbols, walk through backtraces and raw stack data, diagnose patterns such as heap corruption, CPU spike, memory leaks, segmentation faults, wait chains, and deadlocks. If you are not comfortable with the prerequisites, Accelerated Linux Core Dump Analysis training or the corresponding book (included) is recommended before attending this training.
Audience:
Software technical support and escalation engineers, cloud engineers, DevOps and DevSecOps, site reliability engineers, system administrators, security researchers, reverse engineers, malware and memory forensics analysts, software developers, and quality assurance engineers.

Online Training: Accelerated Windows Disassembly, Reconstruction and Reversing
Software Diagnostics Services organizes this online training course.

Learn disassembly, execution history reconstruction, and binary reversing techniques for better software diagnostics, troubleshooting, and debugging on x64 and ARM64 Windows platforms. The course uses a unique, innovative pattern-oriented analysis approach to accelerate learning. The training consists of practical step-by-step, hands-on exercises using WinDbg and memory dumps. Covered more than 25 ADDR patterns, and many concepts are illustrated with Memory Cell Diagrams. The prerequisites for this training are a working knowledge of C and C++. Operating system internals and assembly language concepts are explained when necessary. The primary audience for this training is software technical support and escalation engineers who analyze memory dumps from complex software environments and need to go deeper in their analysis of abnormal and malicious software structure and behavior. The course is also useful for software engineers, quality assurance and software maintenance engineers who debug software running across diverse cloud and endpoint environments, security and vulnerability researchers, and malware and memory forensics analysts who have never used WinDbg for analysis of computer memory. The course builds upon and extends the basic patterns introduced in the Practical Foundations of Windows Debugging, Disassembling, Reversing book. The new version includes an overview of relevant ARM64 assembly language and the ARM64 version of the exercises, as well as an exploration of the impact of AI.
Registration: TBD
Slides from the previous training
Before the training, you get:
- Practical Foundations of Windows Debugging, Disassembling, Reversing, Third Edition PDF book
- The previous PDF book version and recording of the training
- Access to Software Diagnostics Library
After the training, you also get:
- The new 4th edition PDF book of the training
- Personalized Certificate of Attendance with unique CID
- Answers to questions during training sessions
- New recording
Online Training: Accelerated Windows API for Software Diagnostics
Software Diagnostics Services organizes this online training course.
Registration: TBD

Slides from the previous training sessions
Knowledge of Windows API is necessary for:
- Development
- Malware analysis
- Vulnerability analysis and exploitation
- Reversing
- Diagnostics
- Debugging
- Memory forensics
- Crash and hang analysis
- Secure coding
- Static code analysis
- Trace and log analysis
The training uses a unique and innovative pattern-oriented analysis approach and provides:
- Overview
- Classification
- Patterns
- Internals
- Development examples
- Analysis examples
The new version also includes a relevant ARM64 disassembly overview, ARM64 exercises, and an exploration of the impact of AI.
Before the training, you get:
- Practical Foundations of Windows Debugging, Disassembling, Reversing, Third Edition PDF book
- The current PDF book version of the training
- The previous recording
- Access to Software Diagnostics Library
After the training, you also get:
- The updated PDF book version of the training
- Personalized Certificate of Attendance with unique CID
- Recording
Online Training: Extended Windows Memory Dump Analysis
![]()
Software Diagnostics Services (PatternDiagnostics.com) organizes a training course:
Registration: TBD
Extended Windows Memory Dump Analysis: Using and Writing WinDbg Extensions, Database and Event Stream Processing, Visualization training course extends pattern-oriented analysis introduced in Accelerated Windows Memory Dump Analysis, Accelerated .NET Core Memory Dump Analysis, Advanced Windows Memory Dump Analysis with Data Structures, and Accelerated Windows Malware Analysis with Memory Dumps courses with elements of programming, data engineering, data science, machine learning, and AI:
- Surveying the current landscape of WinDbg extensions with analysis pattern mappings
- Writing WinDbg extensions in C, C++, Rust, and Python
- Connecting WinDbg to NoSQL databases
- Connecting WinDbg to streaming and log processing platforms
- Querying and visualizing WinDbg output data
- Using Data Science, Machine Learning, and AI for diagnostics and postmortem debugging
- Using Coding Assistants to automate analysis patterns and model complex problems (new)
- Using GenAI for memory analysis (new)
The new version of the training updates existing and includes entirely new exercises and analysis patterns.
Slides from the previous training
Before the training, you get:
- The current PDF book version and the previous recording of the training
- Practical Foundations of Windows Debugging, Disassembling, Reversing, Third Edition PDF book
- Access to Software Diagnostics Library
After the training, you also get:
- The new edition of the PDF book version of the training
- Personalized Certificate of Attendance with unique CID
- Answers to questions during training sessions
- New recording
Prerequisites: Working knowledge of WinDbg. Working knowledge of Python, C, C++, or Rust is optional (required only for some exercises). Other concepts are explained when necessary.
Audience: Software developers, software maintenance engineers, escalation engineers, quality assurance engineers, security and vulnerability researchers, malware and memory forensics analysts who want to build memory analysis pipelines.
Online Training: Practical Foundations of ARM64 Windows Debugging, Disassembling, and Reversing
Software Diagnostics Services organizes this online training course.

Registration: TBD
This training course is an ARM64 version of the best-selling Practical Foundations of Windows Debugging, Disassembling, Reversing book which drew inspiration from the original lectures we developed more than 22 years ago to train support and escalation engineers in debugging and crash dump analysis of memory dumps from Windows applications, services, and systems. When considering the material to deliver, we realized that a solid understanding of fundamentals, such as pointers, is necessary to analyze stack traces beyond a few WinDbg commands. Therefore, this book was not about bugs or debugging techniques but about the background knowledge everyone needs to start experimenting with WinDbg, learn from practical experience, and read other advanced debugging books. This body of knowledge is what the author of this book possessed before starting memory dump analysis using WinDbg 22 years ago, which led to the number-one debugging bestseller: the multi-volume Memory Dump Analysis Anthology (Diagnomicon). Now, in retrospect, we see these practical foundations as relevant and necessary for beginners, just as they were 22 years ago, because the internals of operating systems, assembly language, and compiler architecture haven't changed significantly in those years.
Please see the x64 book's TOC for the approximate content.
After the training, you get:
- The PDF book edition
- Personalized Certificate of Attendance with unique CID
- Answers to questions during training sessions
- Training sessions recording
Audience:
- Software technical support and escalation engineers
- Software engineers coming from x86/x64, managed code, or JVM background
- Software testers
- Engineers coming from non-Wintel environments
- Windows C and C++ software engineers without an assembly language background
- Security researchers without ARM64 assembly language background
- Beginners learning Windows software reverse engineering techniques
Online Training: Memory Thinking for Python
Software Diagnostics Services organizes this online training course.

Registration: TBD
Solid memory-related knowledge is essential for understanding and carrying out diagnostics, root cause analysis, debugging, and performance improvement, rather than merely listing backtraces and watching print statements. Drawing inspiration from earlier Memory Thinking courses and books for C & C++ and Rust, as well as the book Python Debugging for AI, Machine Learning, and Cloud Computing, Memory Thinking for Python surveys memory-related topics across the Python language, its runtime, and OS internals, including topics often omitted or glossed over in other courses and books, to help practitioners reason more deeply about program behavior in both their own and AI-generated code, diagnose problems more effectively, and develop more efficient Python code.
After the training, you get:
- The PDF book version of the training
- Personalized Certificate of Attendance with unique CID
- Answers to questions during training sessions
- Training sessions recording
Mathematical Concepts in Software Diagnostics and Software Data Analysis
Various mathematical analogies and metaphors inspired memory and log analysis patterns and some concepts of software diagnostics and software data analysis. We list them in alphabetical order:
• 2-categories
• Adjoints, see also
• Bethe ansatz
• Braid groups
• Braids, see also
• Cartesian product
• Categories
• Causal sets, see also, and also
• Coalgebras, functors, 2-categories
• Cones
• Continuous and discontinuous functions
• Cover
• Critical points, Morse theory
• Curves
• Defect group of a block
• Derivatives, partial derivatives, see also
• Dessin d’enfant
• Dimension
• Direct sums and products of sets, see also
• Divergence, see also
• Dual categories
• Duality
• Dynamical systems
• Edge contraction
• Equivalence relation
• Fiber bundles, see also
• Fibrations
• Fixed points
• Flag, filtration
• Foliation
• Fourier series
• Functor
• Fuzzy sets
• Galois connections
• Graphs, see also
• Hasse diagrams
• Homotopy, see also
• Injections, surjections, bijections
• Intervals
• Isomorphism
• Jaccard index
• Karnaugh map
• Lattices
• Manifolds, gluing
• Maps, see also
• Minimal surface
• Model Theory
• Moduli space
• Monoids
• Motives, see also
• Motivic integration
• Nerve complex
• Open and closed sets
• Operads
• Orbifolds
• Order duality
• Ordinals
• Feynman path integral
• Phase
• Piecewise linear functions
• Poincaré map, Poincaré section
• Polynomials
• Posets
• Powerset
• Presheaves
• Projective spaces
• Quotient groups
• Quotient space
• Retraction
• Riemann surfaces, multivalued functions
• Residue
• Rough sets
• Scalar field
• Semigroups, see also
• Sheaves
• Significant digits
• Simplicial complex
• Step functions
• Structure Sheaf
• Surfaces
• Tensors
• Topology
• Ultrametric spaces, p-adic numbers
• Variadic functions
• Whiskering, also
The links to their definitions and examples can be found in the corresponding references. We give the original references to Memory Dump Analysis Anthology where possible, but most of them can also be found in Pattern-Oriented Software Diagnostics Reference books.
Accelerated Windows Memory Dump Analysis, Seventh Edition, Part 2: Kernel and Complete Spaces
The following direct links can be used to order the book now:
Available in PDF format from Software Diagnostics Services
Available in PDF format from Leanpub
Available in Kindle print replica format from Amazon
The book is also included in the following training courses, training packs, and reference sets:
Windows Kernel Programming Supplement
WinDbg Training Pack
Foundations of Windows Memory Dump Analysis Training Pack
Windows Memory Dump Analysis for Endpoint Security Training Pack
Pattern-Oriented Windows Victimware Analysis Training Pack
Pattern-Oriented Memory Dump Analysis Training Pack
Pattern-Oriented Windows Crash Dump Analysis Training Pack
Pattern-Oriented Windows Debugging Training Pack
Pattern-Oriented Complete Windows Memory Dump Analysis Training Pack
Complete Pattern-Oriented Software Diagnostics Training Pack
Available in PDF format from Software Diagnostics Services
The full-color transcript of Software Diagnostics Services training sessions with 15 step-by-step exercises, notes, source code of specially created modeling applications, and 45 questions and answers. Covers more than 50 crash dump analysis patterns from the x64 and ARM64 kernel and complete (physical) memory dumps. Learn how to analyze system crashes and freezes, navigate through the kernel and complete spaces, and diagnose patterns of abnormal software behavior with the WinDbg debugger. The training uses a unique, innovative pattern-oriented analysis approach developed by Software Diagnostics Institute to accelerate learning. Prerequisites: Basic Windows troubleshooting. Audience: Software technical support and escalation engineers, system administrators, security researchers, reverse engineers, malware and memory forensics analysts, software developers and quality assurance engineers, and site reliability engineers. The 7th edition was fully reworked for the latest WinDbg version and includes memory dump setup and collection methods, an additional ARM64 memory dump analysis exercise, and a relevant review of x64 and ARM64 assembly languages.
- Title: Accelerated Windows Memory Dump Analysis, Seventh Edition, Part 2, Kernel and Complete Spaces: Training Course Transcript and WinDbg Practice Exercises with Notes
- Authors: Dmitry Vostokov, Software Diagnostics Services
- Publisher: OpenTask (February 2026)
- Language: English
- PDF: 430 pages
- ISBN-13: 978-1912636068
Accelerated Windows Memory Dump Analysis, Seventh Edition, Part 1: Process User Space
The following direct links can be used to order the book now:
Available in PDF format from Software Diagnostics Services
Available in PDF format from Leanpub
Available in Kindle print replica format from Amazon
The book is also included in the following training courses, training packs, and reference sets:
WinDbg Training Pack
Foundations of Windows Memory Dump Analysis Training Pack
Windows Memory Dump Analysis for Endpoint Security Training Pack
Pattern-Oriented Windows Victimware Analysis Training Pack
Pattern-Oriented Memory Dump Analysis Training Pack
Pattern-Oriented Windows Crash Dump Analysis Training Pack
Pattern-Oriented Windows Debugging Training Pack
Pattern-Oriented Complete Windows Memory Dump Analysis Training Pack
Complete Pattern-Oriented Software Diagnostics Training Pack
The full-color transcript of Software Diagnostics Services training sessions with 26 step-by-step exercises, notes, source code of specially created modeling applications, and more than 70 questions and answers. Covers more than 60 crash dump analysis patterns from x64 and ARM64 process memory dumps. Learn how to analyze application and service crashes and freezes, navigate through process user space, and diagnose heap corruption, memory and handle leaks, CPU spikes, blocked threads, deadlocks, wait chains, and many more patterns of abnormal software behavior with the WinDbg debugger. The training uses a unique, innovative pattern-oriented analysis approach developed by the Software Diagnostics Institute to accelerate learning. Prerequisites: Basic Windows troubleshooting. Audience: Software technical support and escalation engineers, system administrators, security researchers, reverse engineers, malware and memory forensics analysts, software developers and quality assurance engineers, and site reliability engineers. The 7th edition was fully reworked for the latest WinDbg version and includes memory dump collection methods, defect mechanism patterns, additional Windows 11 ARM64 memory dump analysis exercises, and a relevant review of x64 and ARM64 assembly languages.
- Title: Accelerated Windows Memory Dump Analysis, Seventh Edition, Part 1, Process User Space: Training Course Transcript and WinDbg Practice Exercises with Notes
- Authors: Dmitry Vostokov, Software Diagnostics Services
- Publisher: OpenTask (February 2026)
- Language: English
- PDF: 414 pages
- ISBN-13: 978-1912636181
Online Training: Accelerated C & C++ for Linux Diagnostics
Software Diagnostics Services organizes this online training course.
![]()
For approximate training content, please see the first 45 slides (there are 297 slides in total for the previous version) and TOC from the corresponding previous edition of the Memory Thinking book.
Registration: TBD
Solid C and C++ knowledge is a must to fully understand Linux diagnostic artifacts, such as core dumps, and perform diagnostic, forensic, and root cause analysis beyond listing backtraces. Accelerated C and C++ for Linux Software Diagnostics training reviews memory-related topics from the perspective of software structure and behavior analysis, and teaches C and C++ languages in parallel while demonstrating relevant code internals using GDB:
- a tour of relevant language(s) constructs - classic/legacy C++, C++11, and later standards including C++23
- Linux specifics
- pointers and references
- memory layout of structures and objects
- local, static, and dynamic memory
- object lifecycle
- templates and standard library
- functions, function objects, and lambdas
- compilation and linkage
- multithreading and synchronization
- bad and insecure code
- … and much more
The new version will expand on many topics, including Linux kernel space.
System programming on Linux using C and C++ is unthinkable without the Linux API. To avoid repeating some topics and save time, the training includes the Accelerated Linux API for Software Diagnostics book as a follow-up or additional reference. A necessary x64 and ARM64 review for some topics is also included.
Before the training, you get the following:
- The current second edition of Memory Thinking for C & C++ Linux Diagnostics PDF book of the training
- Accelerated Linux API for Software Diagnostics PDF book
- Access to Software Diagnostics Library
- Recording of the previous training
After the training, you also get the following:
- The new third edition of the Memory Thinking PDF book with additional C and C++ examples
- Personalized Certificate of Attendance with unique CID
- The new recording
Pattern-Oriented Diagnostics and Cybersecurity: A Contest Between Patterns

Cybersecurity is often described as an arms race between attackers and defenders, but this framing obscures what is actually contested. The struggle is not primarily over tools, exploits, or even visibility. It is a contest between patterns: patterns of action, patterns of observability, and patterns of interpretation. Attacks succeed or fail not simply because signals are present or absent, but because those signals are read correctly or misread under adversarial conditions.
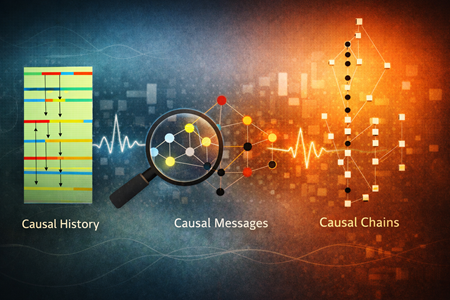
Causal Sets and Pattern-Oriented Diagnostics
Pattern-Oriented Diagnostics begins with a simple observation: execution does not unfold linearly, and logs do not represent time. What engineers habitually call timelines are conveniences imposed by representation, not properties of execution itself. Causal set theory reaches the same conclusion from a foundational perspective. It discards spacetime as a primitive and replaces it with a discrete set of events related only by possible causation. In both cases, order precedes time, and structure precedes explanation.
Pattern-Oriented Diagnostics and Observability as a Philosophy of Engineering
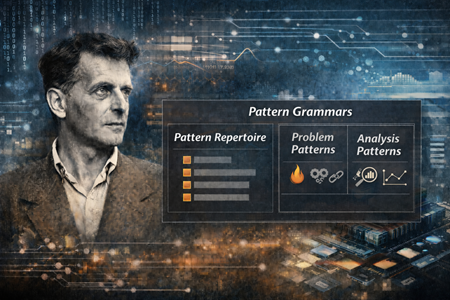
From Correspondence to Grammar, from Problem Patterns to Analysis Patterns
Introduction
Pattern-Oriented Diagnostics and Observability of World Models: A Topological Perspective

Introduction
Pattern-Oriented Diagnostics and Observability: A Reflection on 2025

Software systems no longer fail in isolation. They evolve, adapt, learn, and interact with environments that are only partially observable. As systems have grown more complex, the act of diagnosing them has remained largely artisanal, dependent on tools, experience, and intuition, but resistant to formalisation. My work began many years ago from a simple conviction: diagnostics deserves to be a discipline.