Multiple Exceptions (user mode) - Modeling Example
 Multiple Exceptions (kernel mode)
 Multiple Exceptions (managed space)
- Multiple Exceptions (stowed)
 Dynamic Memory Corruption (process heap)
 Dynamic Memory Corruption (kernel pool)
- Dynamic Memory Corruption (managed heap)
 False Positive Dump
 Lateral Damage (general)
- Lateral Damage (CPU mode)
 Optimized Code (function parameter reuse)
 Invalid Pointer (general)
- Invalid Pointer (objects)
 NULL Pointer (code)
 NULL Pointer (data)
 Inconsistent Dump
 Hidden Exception (user space)
- Hidden Exception (kernel space)
- Hidden Exception (managed space)
 Deadlock (critical sections)
 Deadlock (executive resources)
 Deadlock (mixed objects, user space)
 Deadlock (LPC)
 Deadlock (mixed objects, kernel space)
 Deadlock (self)
- Deadlock (managed space)
- Deadlock (.NET Finalizer)
 Changed Environment
 Incorrect Stack Trace
 OMAP Code Optimization
 No Component Symbols
 Insufficient Memory (committed memory)
 Insufficient Memory (handle leak)
 Insufficient Memory (kernel pool)
 Insufficient Memory (PTE)
 Insufficient Memory (module fragmentation)
 Insufficient Memory (physical memory)
 Insufficient Memory (control blocks)
- Insufficient Memory (reserved virtual memory)
- Insufficient Memory (session pool)
- Insufficient Memory (stack trace database)
- Insufficient Memory (region)
- Insufficient Memory (stack)
 Spiking Thread
 Module Variety
 Stack Overflow (kernel mode)
 Stack Overflow (user mode)
 Stack Overflow (software implementation)
- Stack Overflow (insufficient memory)
- Stack Overflow (managed space)
 Managed Code Exception
- Managed Code Exception (Scala)
- Managed Code Exception (Python)
 Truncated Dump
 Waiting Thread Time (kernel dumps)
 Waiting Thread Time (user dumps)
 Memory Leak (process heap) - Modeling Example
 Memory Leak (.NET heap)
- Memory Leak (page tables)
- Memory Leak (I/O completion packets)
- Memory Leak (regions)
 Missing Thread (user space)
- Missing Thread (kernel space)
 Unknown Component
 Double Free (process heap)
 Double Free (kernel pool)
 Coincidental Symbolic Information
 Stack Trace
- Stack Trace (I/O request)
- Stack Trace (file system filters)
- Stack Trace (database)
- Stack Trace (I/O devices)
 Virtualized Process (WOW64)
- Virtualized Process (ARM64EC and CHPE)
 Stack Trace Collection (unmanaged space)
- Stack Trace Collection (managed space)
- Stack Trace Collection (predicate)
- Stack Trace Collection (I/O requests)
- Stack Trace Collection (CPUs)
 Coupled Processes (strong)
 Coupled Processes (weak)
 Coupled Processes (semantics)
 High Contention (executive resources)
 High Contention (critical sections)
 High Contention (processors)
- High Contention (.NET CLR monitors)
- High Contention (.NET heap)
- High Contention (sockets)
 Accidental Lock
 Passive Thread (user space)
 Passive System Thread (kernel space)
 Main Thread
 Busy System
 Historical Information
 Object Distribution Anomaly (IRP)
- Object Distribution Anomaly (.NET heap)
 Local Buffer Overflow (user space)
- Local Buffer Overflow (kernel space)
 Early Crash Dump
 Hooked Functions (user space)
 Hooked Functions (kernel space)
- Hooked Modules
 Custom Exception Handler (user space)
 Custom Exception Handler (kernel space)
 Special Stack Trace
 Manual Dump (kernel)
 Manual Dump (process)
 Wait Chain (general)
 Wait Chain (critical sections)
 Wait Chain (executive resources)
 Wait Chain (thread objects)
 Wait Chain (LPC/ALPC)
 Wait Chain (process objects)
 Wait Chain (RPC)
 Wait Chain (window messaging)
 Wait Chain (named pipes)
- Wait Chain (mutex objects)
- Wait Chain (pushlocks)
- Wait Chain (CLR monitors)
- Wait Chain (RTL_RESOURCE)
- Wait Chain (modules)
- Wait Chain (nonstandard synchronization)
- Wait Chain (C++11, condition variable)
- Wait Chain (SRW lock)
 Corrupt Dump
 Dispatch Level Spin
 No Process Dumps
 No System Dumps
 Suspended Thread
 Special Process
 Frame Pointer Omission
 False Function Parameters
 Message Box
 Self-Dump
 Blocked Thread (software)
 Blocked Thread (hardware)
- Blocked Thread (timeout)
 Zombie Processes
 Wild Pointer
 Wild Code
 Hardware Error
 Handle Limit (GDI, kernel space)
- Handle Limit (GDI, user space)
 Missing Component (general)
 Missing Component (static linking, user mode)
 Execution Residue (unmanaged space, user)
- Execution Residue (unmanaged space, kernel)
- Execution Residue (managed space)
 Optimized VM Layout
- Invalid Handle (general)
- Invalid Handle (managed space)
- Overaged System
- Thread Starvation (realtime priority)
- Thread Starvation (normal priority)
- Duplicated Module
- Not My Version (software)
- Not My Version (hardware)
- Data Contents Locality
- Nested Exceptions (unmanaged code)
- Nested Exceptions (managed code)
- Affine Thread
- Self-Diagnosis (user mode)
- Self-Diagnosis (kernel mode)
- Self-Diagnosis (registry)
- Inline Function Optimization (unmanaged code)
- Inline Function Optimization (managed code)
- Critical Section Corruption
- Lost Opportunity
- Young System
- Last Error Collection
- Hidden Module
- Data Alignment (page boundary)
- C++ Exception
- Divide by Zero (user mode)
- Divide by Zero (kernel mode)
- Swarm of Shared Locks
- Process Factory
- Paged Out Data
- Semantic Split
- Pass Through Function
- JIT Code (.NET)
- JIT Code (Java)
- Ubiquitous Component (user space)
- Ubiquitous Component (kernel space)
- Nested Offender
- Virtualized System
- Effect Component
- Well-Tested Function
- Mixed Exception
- Random Object
- Missing Process
- Platform-Specific Debugger
- Value Deviation (stack trace)
- Value Deviation (structure field)
- Runtime Thread (CLR)
- Runtime Thread (Python, Linux)
- Coincidental Frames
- Fault Context
- Hardware Activity
- Incorrect Symbolic Information
- Message Hooks - Modeling Example
- Coupled Machines
- Abridged Dump
- Exception Stack Trace
- Distributed Spike
- Instrumentation Information
- Template Module
- Invalid Exception Information
- Shared Buffer Overwrite
- Pervasive System
- Problem Exception Handler
- Same Vendor
- Crash Signature
- Blocked Queue (LPC/ALPC)
- Fat Process Dump
- Invalid Parameter (process heap)
- Invalid Parameter (runtime function)
- String Parameter
- Well-Tested Module
- Embedded Comment
- Hooking Level
- Blocking Module
- Dual Stack Trace
- Environment Hint
- Top Module
- Livelock
- Technology-Specific Subtrace (COM interface invocation)
- Technology-Specific Subtrace (dynamic memory)
- Technology-Specific Subtrace (JIT .NET code)
- Technology-Specific Subtrace (COM client call)
- Dialog Box
- Instrumentation Side Effect
- Semantic Structure (PID.TID)
- Directing Module
- Least Common Frame
- Truncated Stack Trace
- Data Correlation (function parameters)
- Data Correlation (CPU times)
- Module Hint
- Version-Specific Extension
- Cloud Environment
- No Data Types
- Managed Stack Trace
- Managed Stack Trace (Scala)
- Managed Stack Trace (Python)
- Coupled Modules
- Thread Age
- Unsynchronized Dumps
- Pleiades
- Quiet Dump
- Blocking File
- Problem Vocabulary
- Activation Context
- Stack Trace Set
- Double IRP Completion
- Caller-n-Callee
- Annotated Disassembly (JIT .NET code)
- Annotated Disassembly (unmanaged code)
- Handled Exception (user space)
- Handled Exception (.NET CLR)
- Handled Exception (kernel space)
- Duplicate Extension
- Special Thread (.NET CLR)
- Hidden Parameter
- FPU Exception
- Module Variable
- System Object
- Value References
- Debugger Bug
- Empty Stack Trace
- Problem Module
- Disconnected Network Adapter
- Network Packet Buildup
- Unrecognizable Symbolic Information
- Translated Exception
- Regular Data
- Late Crash Dump
- Blocked DPC
- Coincidental Error Code
- Punctuated Memory Leak
- No Current Thread
- Value Adding Process
- Activity Resonance
- Stored Exception
- Spike Interval
- Stack Trace Change
- Unloaded Module
- Deviant Module
- Paratext
- Incomplete Session
- Error Reporting Fault
- First Fault Stack Trace
- Frozen Process
- Disk Packet Buildup
- Hidden Process
- Active Thread (Mac OS X)
- Active Thread (Windows)
- Critical Stack Trace
- Handle Leak
- Module Collection
- Module Collection (predicate)
- Deviant Token
- Step Dumps
- Broken Link
- Debugger Omission
- Glued Stack Trace
- Reduced Symbolic Information
- Injected Symbols
- Distributed Wait Chain
- One-Thread Process
- Module Product Process
- Crash Signature Invariant
- Small Value
- Shared Structure
- Thread Cluster
- False Effective Address
- Screwbolt Wait Chain
- Design Value
- Hidden IRP
- Tampered Dump
- Memory Fluctuation (process heap)
- Last Object
- Rough Stack Trace (unmanaged space)
- Rough Stack Trace (managed space)
- Past Stack Trace
- Ghost Thread
- Dry Weight
- Exception Module
- Reference Leak
- Origin Module
- Hidden Call
- Corrupt Structure
- Software Exception
- Crashed Process
- Variable Subtrace
- User Space Evidence
- Internal Stack Trace
- Distributed Exception (managed code)
- Thread Poset
- Stack Trace Surface
- Hidden Stack Trace
- Evental Dumps
- Clone Dump
- Parameter Flow
- Critical Region
- Diachronic Module
- Constant Subtrace
- Not My Thread
- Window Hint
- Place Trace
- Stack Trace Signature
- Relative Memory Leak
- Quotient Stack Trace
- Module Stack Trace
- Foreign Module Frame
- Unified Stack Trace
- Mirror Dump Set
- Memory Fibration
- Aggregated Frames
- Frame Regularity
- Stack Trace Motif
- System Call
- Stack Trace Race
- Hyperdump
- Disassembly Ambiguity
- Exception Reporting Thread
- Active Space
- Subsystem Modules
- Region Profile
- Region Clusters
- Source Stack Trace
- Hidden Stack
- Interrupt Stack
- False Memory
- Frame Trace
- Pointer Cone
- Context Pointer
- Pointer Class
- False Frame
- Procedure Call Chain
- C++ Object
- COM Exception
- Structure Sheaf
- Saved Exception Context (.NET)
- Shared Thread
- Spiking Interrupts
- Structure Field Collection
- Black Box
- Rough Stack Trace Collection (unmanaged space)
- COM Object
- Shared Page
- Exception Collection
- Dereference Nearpoint
- Address Representations
- Near Exception
- Shadow Stack Trace
- Past Process
- Foreign Stack
- Annotated Stack Trace
- Disassembly Summary
- Region Summary
- Analysis Summary
- Region Spectrum
- Normalized Region
- Function Pointer
- Interrupt Stack Collection
- DPC Stack Collection
- Dump Context
- False Local Address
- Encoded Pointer
- Latent Structure
- ISA-Specific Code
Book: Accelerated Windows Software Trace Analysis
The following direct links can be used to order the book now:
Buy Kindle version
Buy Paperback from Amazon
Buy Paperback from Barnes & Noble
Buy Paperback from Book Depository
Available for SkillSoft Books24x7 subscribers
![]()
Also available in PDF format + recording from Software Diagnostics Services.
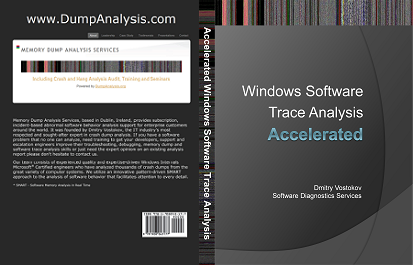
The full transcript of Software Diagnostics Services training. Feel frustrated when opening a software trace with millions of messages from hundreds of software components, threads and processes? Go beyond simple CPU and disk hog monitoring or searching for errors in a text and learn how to efficiently and effectively analyze software traces and logs from complex software environments. Covered popular software logs and trace formats from Microsoft and Citrix products and tools including Event Tracing for Windows (ETW) and Citrix Common Diagnostics Format (CDF). This course teaches using pioneering and innovative pattern-driven and pattern-based analysis of abnormal software behavior incidents developed by Software Diagnostics Institute.
- Title: Accelerated Windows Software Trace Analysis: Training Course Transcript
- Authors: Dmitry Vostokov, Software Diagnostics Services
- Publisher: OpenTask (January 2013)
- Language: English
- Product Dimensions: 28.0 x 21.6
- Paperback: 130 pages
- ISBN-13: 978-1908043429
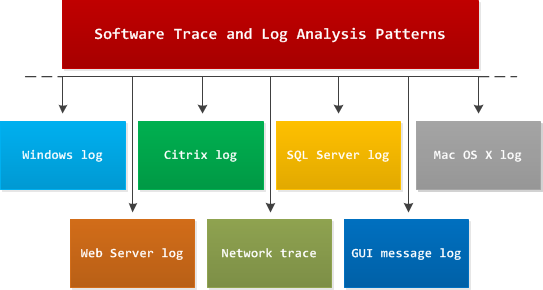
Software Trace Analysis Problem Domain Pattern Hierarchy
Software log analysis patterns from Software Diagnostics Institute are independent from any OS, platform or product because they are based on viewing software logs as stories of computation and were discovered by application of narratological analysis (software narratology). In addition to these patterns there exist domain specific problem patterns such as wrong hotfix level or specific product error code during software installation or execution. Typical examples of support for such platform and product specific type of patterns include Microsoft Windows Problem Reporting and Citrix Auto Support.
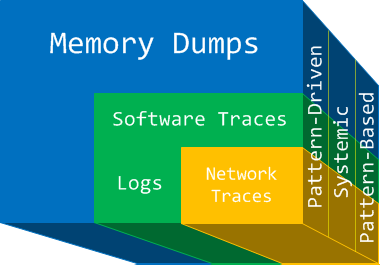
Software Diagnostics Discipline
Let’s define software diagnostics as a discipline studying abnormal software structure and behavior in software execution artifacts (such as memory dumps, software and network traces and logs) using pattern-driven, systemic and pattern-based analysis methodologies.
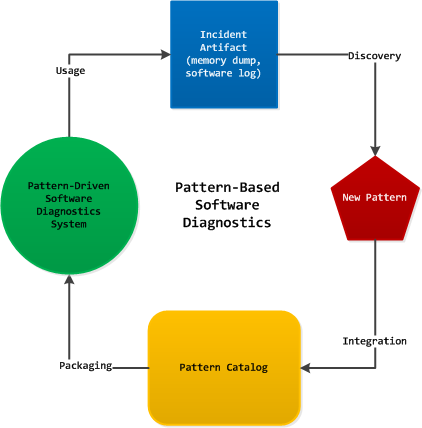
Pattern-Based v. Pattern-Driven Software Diagnostics
Pattern-driven software post-construction problem solving involves using preexisting pattern languages and pattern catalogs for software diagnostics, troubleshooting and debugging. Pattern-based software post-construction problem solving addresses PLS (Pattern Life Cycle) - from the discovery of a new pattern through its integration into an existing catalog and language, testing, packaging and delivering to pattern consumers with subsequent usage, refactoring and writing case studies:
Software Diagnostics Certifications
The first software diagnostics certification in memory dump analysis starts this September and will be administered by Software Diagnostics Services:
http://www.patterndiagnostics.com/memory-dump-analysis-certification-out...
We also plan a beta software trace analysis certification.
For companies there is also available Software Diagnostics Maturity enterprise certification:
http://www.patterndiagnostics.com/software-diagnostics-maturity
CARE: Crash Analysis Report Environment
Welcome to the project CARE!
We now also accept GDB logs and crash reports from Mac OS X and iOS.
CARE means Crash Analysis Report Environment. It includes a pattern-driven debugger log analyzer and standards for structured audience-driven reports. The system architecture is described here.
Please help to populate the database of stack traces by submitting your WinDbg and GDB output logs including Mac OS X and iOS crash reports. For Windows you can use VBScript / WinDbg script to process all .DMP files on your hard drives: DebuggerLogs.zip. The archive contains VBScript file for x64 WinDbg (DebuggerLogs64.vbs) and for x86 WinDbg (DebuggerLogs.vbs) plus the very simple mode-independent WinDbg script (DebuggerLogs.wds). The WinDbg output is stored in dbgeng.log file.
Note: Please do not submit your crash or core dumps because the file size is limited to 2 MB and CARE system is currently being designed to analyze debugger logs and crash reports only. If your log is bigger you can submit a zip file. If you have any problems please contact the administrator. Please do not expect any crash analysis response for your logs or reports. The submittal is currently for internal CARE database population only and not for the pattern analysis of your computer memory.
Rosetta Stone for Debuggers
Under inscription...
The name for this table was suggested by Joshua J. Drake and first propagated to me by @jcran
Action                      | GDB                 | WinDbg
----------------------------------------------------------------
Start the process           | run                 | g
Exit                        | (q)uit              | q
Disassemble (forward)       | (disas)semble       | uf, u
Disassemble N instructions  | x/<N>i              | -
Disassemble (backward)      | disas <a-o> <a>     | ub
Stack trace                 | backtrace (bt)      | k
Full stack trace            | bt full             | kv
Stack trace with parameters | bt full             | kP
Partial trace (innermost)   | bt <N>              | k <N>
Partial trace (outermost)   | bt -<N>             | -
Stack trace for all threads | thread apply all bt | ~*k
Breakpoint                  | break               | bp
Frame numbers               | any bt command      | kn
Select frame                | frame               | .frame
Display parameters          | info args           | dv /t /i /V
Display locals              | info locals         | dv /t /i /V
Dump byte char array        | x/<N>bc             | db
Switch to thread            | thread <N>          | ~<N>s
Sections/regions            | maint info sections | !address
Load symbol file            | add-symbol-file     | .reload
CPU registers               | i(nfo) r            | r
The current version is from April 30th, 2012:
http://www.dumpanalysis.org/blog/index.php/2012/04/30/gdb-for-windbg-users-part-8/
To Do:
- Split rows by categories
- Add links to command descriptions, examples, relevant patterns
Introduction to Software Narratology
The following direct links can be used to order the book now:
Buy Kindle or Paperback
 from Amazon
Buy Paperback from Barnes & Noble
Buy Paperback from Book Depository
This is a transcript of Memory Dump Analysis Services seminar about Software Narratology: an exciting new discipline and a field of research founded by DumpAnalysis.org. When software executes it gives us its stories in the form of UI events, software traces and logs. Such stories can be analyzed for their structure and patterns for troubleshooting, debugging and problem resolution purposes. Topics also include software narremes and their types, anticipatory software construction and software diagnostics.
- Title: Software Narratology: An Introduction to the Applied Science of Software Stories
- Authors: Dmitry Vostokov, Memory Dump Analysis Services
- Publisher: OpenTask (April 2012)
- Language: English
- Product Dimensions: 28.0 x 21.6
- Paperback: 26 pages
- ISBN-13: 978-1908043078

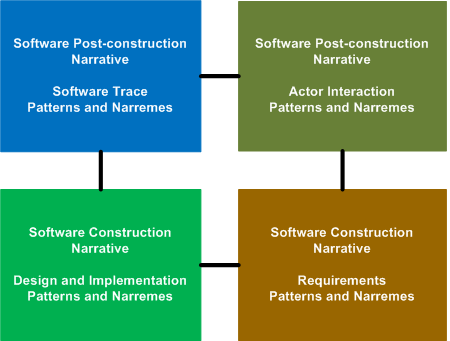
Software Narratology
This newly expanded field studies all types of narratives in software construction and post-construction.
For details please visit our blog:
http://www.dumpanalysis.org/blog/index.php/2012/03/11/software-narratolo...
http://www.dumpanalysis.org/blog/index.php/2012/03/11/software-narrative...
http://www.dumpanalysis.org/blog/index.php/2012/02/02/narremes-in-softwa...
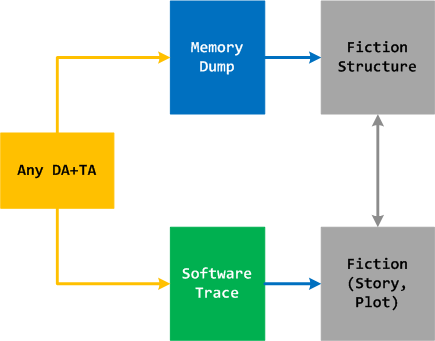
Memoretics Helps Writing Fiction
One of sources of Memoretics is Narratology to which the former contributes back by providing structural and behavioral analysis patterns and frameworks.
For the full story please visit our blog: http://www.dumpanalysis.org/blog/index.php/2012/02/13/software-narratolo...
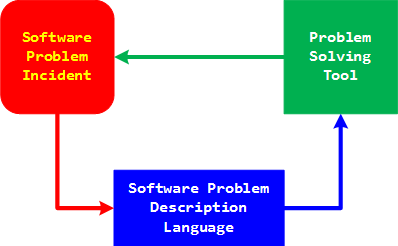
Software Problem Solving Tools as a Service
A software problem incident is described using software problem description language. Its program interpretation or compilation results in a published software problem solving tool. Tools can be reused, parameterized, aggregated and organized into hierarchical catalogs. Welcome to the TaaS of the future!
Analysis Productivity Now!

We have conducted research and our internal case studies show that pattern-driven approach to memory analysis significantly decreases learning time: up to 10 times faster than before if not more. Whereas in the past it could take several years to master crash and hang dump analysis - today it takes a few months.
Software Diagnostics Services provides the first accelerated pattern-driven analysis training to decrease learning time even more while simultaneously lowering the steep learning curve:
Accelerated Windows Memory Dump Analysis Training
Accelerated .NET Memory Dump Analysis Training
Also available:
Advanced Windows Memory Dump Analysis with Data Structures
Windows Debugging: Practical Foundations
The following direct links can be used to order the book now:
Buy Kindle version
Buy Paperback or Hardcover
 from Amazon
Buy Paperback or Hardcover from Barnes & Noble
Buy Paperback or Hardcover from Book Depository
Written by the founder of DumpAnalysis.org this book is not about bugs or debugging techniques but about background knowledge everyone needs to start experimenting with WinDbg, learn from practical experience and read other advanced debugging books. Solid understanding of fundamentals like pointers is needed to analyze stack traces beyond !analyze -v and lmv WinDbg commands. This is the book to help technical support and escalation engineers and Windows software testers without the knowledge of assembly language to master necessary prerequisites to understand and start debugging and crash dump analysis on Windows platforms. It doesn't require any specific knowledge, fills the gap and lowers the learning curve. The book is also useful for software engineers coming from managed code or Java background, engineers coming from non-Wintel environments, Windows C/C++ software engineers without assembly language background, security researchers and beginners learning Windows software disassembling and reverse engineering techniques. This book can also be used as Intel assembly language and Windows debugging supplement for relevant undergraduate level courses.
Product details:
- Title: Windows Debugging: Practical Foundations
- Author: Dmitry Vostokov
- Language: English
- Product Dimensions: 22.86 x 15.24
- Paperback: 200 pages
- ISBN-13: 978-1-906717-10-0
- Publisher: Opentask (01 February 2009)
- Hardback: 200 pages
- ISBN-13: 978-1-906717-67-4
- Publisher: Opentask (23 March 2009)
Praise for the book:
I am a C++/Windows developer and have been a Windows debugging enthusiast for quite a long time now. However, I have never been able to get a good and credible source of information with regards to the internals of debugging using WinDbg. Over the years, I have laid my hands on various sources that deal with Windows Debugging tools and debugging techniques. Every time I purchased a book or went through an online source, I was limited to confusing information that lead me to give up on this topic. Even reliable books that claimed to be the best in the market were nothing less than a colossal disappointment. However, recently when I came across "Windows Debugging: Practical Foundation" that was purchased by a friend of mine, I was sceptic but, nonetheless, decided to give it a chance. Trust me, although not perfect, the book has helped me a lot in learning more about windows internals and debugging techniques. I would like to extend my complements for writing a book that divulges details in a very concise yet clear manner.
Sriram Sarma
Book reviews:
CyberSpace and The Solution to CyberProblems
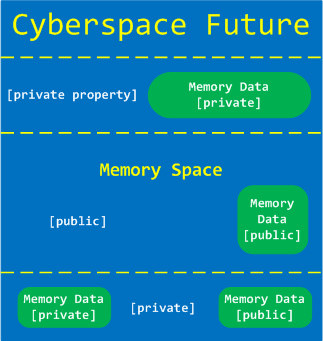
Memoretics views Cyber Space as Memory Space + Memory Data. Here Memory Space consists of many different memory spaces. Although data is private property memory space where it is located is not:
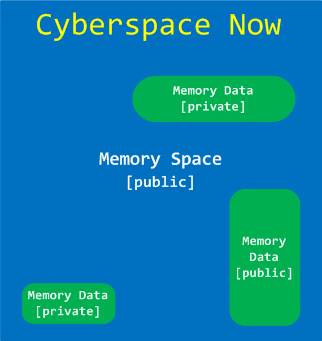
We propose private property on memory spaces and their partitions as a solution to various Cyber problems such as Cyber Crime and Cyber War:
Introduction to Pattern-Driven Software Problem Solving
The following direct links can be used to order the book now:
Buy Kindle or Paperback
 from Amazon
Buy Paperback from Barnes & Noble
Buy Paperback from Book Depository
The full transcript of Memory Dump Analysis Services seminar on pattern-driven software troubleshooting, debugging and maintenance. Topics include: A Short History of DumpAnalysis.org; Memory Dump Analysis Patterns; Troubleshooting and Debugging Tools (Debugware) Patterns; Software Trace Analysis Patterns; From Software Defects to Software Behavior; Workaround Patterns; Structural Memory Patterns; Memory Analysis Domain Pattern Hierarchy; New Directions.
- Title: Introduction to Pattern-Driven Software Problem Solving
- Authors: Dmitry Vostokov, Memory Dump Analysis Services
- Publisher: OpenTask (June 2011)
- Language: English
- Product Dimensions: 28.0 x 21.6
- Paperback: 24 pages
- ISBN-13: 978-1908043177
Uses of Memoretics as Cross- and Interdisciplinary Science
Memoretics as a science of memory snapshots borrows many ideas from the following disciplines (the list is not exhaustive):
- Troubleshooting and Debugging
- Intelligence Analysis
- Critical Thinking
- Forensics
- Linguistics
- Archaeology
- Psychoanalysis
- History
- Mathematics: Sets and Categories
- Literary Criticism and Narratology
It also contributes many ideas back. The following diagram depicts such an interaction:

Memoretics promotes pattern-driven memory dump and software trace analysis which has many uses but not limited to:
- Software and site reliability
- Software Debugging
- QA and Software Testing
- Computer Security
- Software Troubleshooting
- Malware Research and Analysis
- Tools as a Service (TaaS)
- Supportability
- Software Diagnostics

The founding text of Memoretics is Memory Dump Analysis Anthology.
DNA of Software Behavior
We consider memory dump and software trace analysis patterns as units of software behavioral genome. This work started in 2006 and we plan to continue with the publication of volumes 6 - 10 of Memory Dump Analysis Anthology. The release of volume 6 is planned for November-December, 2011.
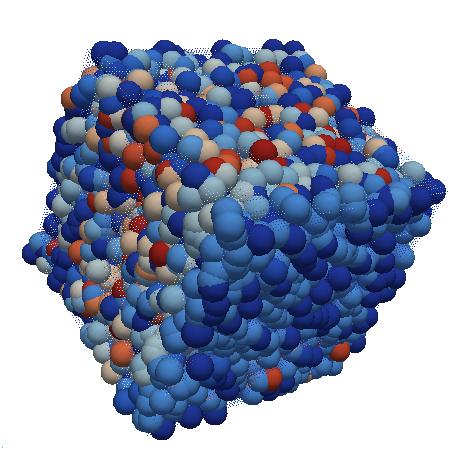
The image was generated using 3D memory visualization techniques.
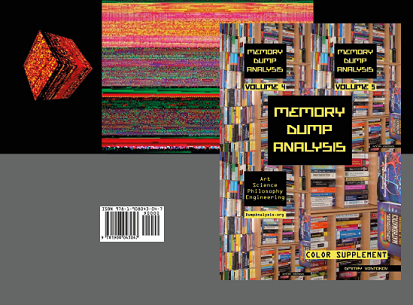
Memory Dump Analysis Anthology: Color Supplement for Volumes 4-5
The following direct links can be used to order the book now:
Buy Paperback from Amazon
Buy Paperback from Barnes & Noble
Buy Paperback from Book Depository
This is a supplemental volume of selected articles with 170 full color illustrations from Memory Dump Analysis Anthology: revised, edited, cross-referenced and thematically organized volumes of selected DumpAnalysis.org blog posts about debugging, modern crash dump and software trace analysis, conceptual physicalist and memory space art, speculative metaphysics of memory dump worldview (memoidealism) written in July 2009 - October 2010 for software engineers developing and maintaining products on Windows platforms, quality assurance engineers testing software on Windows platforms, technical support and escalation engineers dealing with complex software issues, security and defect researchers, reverse engineers and malware analysts, computer security and cyber warfare intelligence professionals, computer scientists, conceptual digital artists and philosophers. Unique in its breadth, depth, and scope it offers unprecedented insight into the world of software behavior and draws profound engineering, scientific, artistic and metaphysical implications.
- Title: Memory Dump Analysis Anthology: Color Supplement for Volumes 4-5
- Author: Dmitry Vostokov
- Publisher: OpenTask (June 2011)
- Language: English
- Product Dimensions: 21.6 x 14.0
- Paperback: 232 pages
- ISBN-13: 978-1908043047
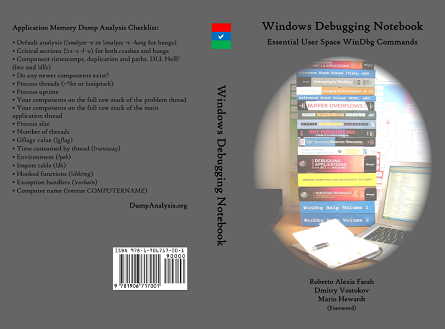
Windows Debugging Notebook: Essential User Space WinDbg Commands
The following direct links can be used to order the book now:
Buy Paperback from Amazon
Buy Paperback from Barnes & Noble
Buy Paperback from Book Depository
This is a reference book for technical support and escalation engineers troubleshooting and debugging complex software issues. The book is also invaluable for software maintenance and development engineers debugging Windows applications and services.
- Title: Windows Debugging Notebook: Essential User Space WinDbg Commands
- Authors: Roberto Alexis Farah, Mario Hewardt (Foreword), Dmitry Vostokov (Editor)
- Language: English
- Product Dimensions: 19.8 x 12.9 cm
- ISBN-13: 978-1-906717-00-1
- Publisher: OpenTask (15 May 2011)
- Paperback: 256 pages
Table of Contents
Book review
Errata
First Fault Software Problem Solving Book
The following direct links can be used to order the book now:
Buy Paperback or Kindle Edition
 from Amazon
Buy Paperback from Barnes & Noble
Buy Paperback from Book Depository
Written by a veteran in mission-critical computer system problem resolution, problem prevention, and system recovery, this book discusses solving problems on their FIRST occurrence while emphasizing software supportability and serviceability.
- Title: First Fault Software Problem Solving: A Guide for Engineers, Managers and Users
- Author: Dan Skwire
- Publisher: Opentask (1 December 2009)
- Language: English
- Product Dimensions: 22.86 x 15.24
- ISBN: 1906717427
- ISBN-13: 978-1906717421
- Paperback: 180 pages
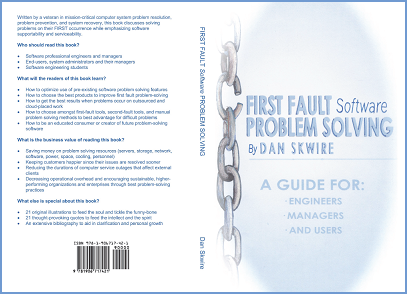
Table of Contents
Amazon reviews
c’t – Magazin für Computertechnik review
Alan Radding's DancingDinosaur and bottomlineIT reviews
Who should read this book?
- Software professional engineers and managers
- End-users, system administrators and their managers
- Software engineering students
What will the readers of this book learn?
- How to optimize use of pre-existing software problem solving features
- How to choose the best products to improve first fault problem-solving
- How to get the best results when problems occur on outsourced and cloud-placed work
- How to choose amongst first-fault tools, second-fault tools, and manual problem solving methods to best advantage for difficult problems
- How to be an educated consumer or creator of future problem-solving software
What is the business value of reading this book?
- Saving money on problem solving resources (servers, storage, network, software, power, space, cooling, personnel)
- Keeping customers happier since their issues are resolved sooner
- Reducing the durations of computer service outages that affect external clients
- Decreasing operational overhead and encouraging sustainable, higher-performing organizations and enterprises through best problem-solving practices
What else is special about this book?
- 21 original illustrations to feed the soul and tickle the funny-bone
- 21 thought-provoking quotes to feed the intellect and the spirit
- An extensive bibliography to aid in clarification and personal growth
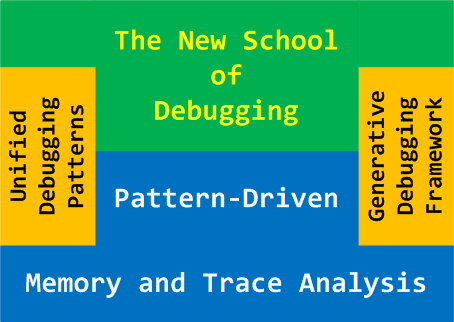
The New School of Debugging
The new founded school integrates traditional multidisciplinary debugging approaches and methodologies with:
- multiplatform pattern-driven software problem solving
- unified debugging patterns
- generative debugging
- best practices in memory dump analysis and software tracing
- computer security
- humanities and social sciences including archaeology and economics
- new emerging trends
Debugging in 2021: Trends for the Next Decade
- Increased complexity of software will bring more methods from biological, social sciences and humanities in addition to existing methods of automated debugging and computer science techniques
- Focus on first fault software problem solving (when aspect)
- Focus on pattern-driven software problem solving (how aspect)
- Fusion of debugging and malware analysis into a unified structural and behavioral pattern framework
- Visual debugging, memory and software trace visualization techniques
- Software maintenance certification
- Focus on domain-driven troubleshooting and debugging tools as a service (debugware TaaS)
- Focus on security issues related to memory dumps and software traces
- New scripting languages and programming language extensions for debugging
- The maturation of the science of memory snapshots and software traces (memoretics)
Memory Dump Analysis Anthology: Color Supplement for Volumes 1-3
The following direct links can be used to order the book now:
Buy Paperback from Amazon
Buy Paperback from Barnes & Noble
Buy Paperback from Book Depository
This is a supplemental volume of selected articles with 68 full color illustrations from Memory Dump Analysis Anthology: revised, edited, cross-referenced and thematically organized volumes of selected DumpAnalysis.org blog posts about modern crash dump analysis and debugging written in August 2006 - June 2009 for software engineers developing and maintaining products on Windows platforms, quality assurance engineers testing software on Windows platforms, technical support and escalation engineers dealing with complex software issues, security and defect researchers, computer scientists and philosophers. Unique in its breadth, depth, and scope it offers unprecedented insight into the world of Windows software and draws profound scientific and metaphysical implications.
- Title: Memory Dump Analysis Anthology: Color Supplement for Volumes 1-3
- Author: Dmitry Vostokov
- Publisher: OpenTask (May 2010)
- Language: English
- Product Dimensions: 21.6 x 14.0
- Paperback: 110 pages
- ISBN-13: 978-1906717698
x64 Windows Debugging: Practical Foundations
The following direct links can be used to order the book now:
Buy Kindle version
Buy Paperback or Hardcover
 from Amazon
Buy Paperback or Hardcover from Barnes & Noble
Buy Paperback or Hardcover from Book Depository
Written by the founder of DumpAnalysis.org this book is not about bugs or debugging techniques but about background knowledge everyone needs to start experimenting with x64 WinDbg, learn from practical experience and read other advanced debugging books. Solid understanding of fundamentals like pointers is needed to analyze stack traces beyond !analyze -v and lmv WinDbg commands. This is the book to help technical support and escalation engineers and Windows software testers without the knowledge of assembly language to master necessary prerequisites to understand and start debugging and crash dump analysis on x64 Windows platforms. It doesn't require any specific knowledge, fills the gap and lowers the learning curve. The book is also useful for software engineers coming from managed code or Java background, engineers coming from non-Wintel environments, Windows C/C++ software engineers without assembly language background, security researchers and beginners learning x64 Windows software disassembling and reverse engineering techniques. This book can also be used as AMD64 and Intel EM64T assembly language and x64 Windows debugging supplement for relevant undergraduate level courses. For someone, who wants to learn these foundations in the context of 32-bit Windows environments there is a separate x86 book (ISBN: 978-1-906717-10-0). However, this book is completely independent from that earlier book and almost every illustration was recreated to reflect x64 architecture and x64 Windows ILP 32-32-64 model (Integer-Long-Pointer).
Product details:
- Title: x64 Windows Debugging: Practical Foundations
- Author: Dmitry Vostokov
- Language: English
- Product Dimensions: 22.86 x 15.24
- Paperback: 194 pages
- Publisher: Opentask (17 August 2009)
- ISBN-13: 978-1-906717-56-8
- Hardcover: 194 pages
- Publisher: Opentask (15 March 2010)
- ISBN-13: 978-1-906717-92-6
Memory Dump Analysis Anthology, Volume 3
The following direct links can be used to order the book now:
Buy Kindle or Paperback
 or Hardcover
 from Amazon
Buy Paperback or Hardcover from Barnes & Noble
Buy Paperback or Hardcover from Book Depository
Also available in PDF format from Software Diagnostics Services
This is a revised, edited, cross-referenced and thematically organized volume of selected DumpAnalysis.org blog posts about crash dump analysis and debugging written in October 2008 - June 2009 for software engineers developing and maintaining products on Windows platforms, quality assurance engineers testing software on Windows platforms and technical support and escalation engineers dealing with complex software issues. The third volume features:
- 15 new crash dump analysis patterns
- 29 new pattern interaction case studies
- Trace analysis patterns
- Updated checklist
- Fully cross-referenced with Volume 1 and Volume 2
- New appendixes
Product information:
- Title: Memory Dump Analysis Anthology, Volume 3
- Author: Dmitry Vostokov
- Language: English
- Product Dimensions: 22.86 x 15.24
- Paperback: 404 pages
- Publisher: Opentask (20 December 2009)
- ISBN-13: 978-1-906717-43-8
- Hardcover: 404 pages
- Publisher: Opentask (15 March 2010)
- ISBN-13: 978-1-906717-44-5

Back cover features 3D computer memory visualization image.
Debugged! MZ/PE: MagaZine for/from Practicing Engineers
As one of the new initiatives for the Year of Debugging (2009, 0x7D9) OpenTask starts publishing full color variable page periodical publication called:
Debugged! MZ/PE: MagaZine for/from Practicing Engineers
The only serial publication dedicated entirely to Windows® debugging
The following direct links can be used to order issues now:
Order March, 2009 issue from Amazon or Barnes & Noble
New! Now available for Kindle
Order June, 2009 issue from Amazon or Barnes & Noble
Order September, 2009 issue from Amazon or Barnes & Noble
Order March, 2010 issue from Amazon or Barnes & Noble
Sample magazine back covers featuring debugging, crash dump and software trace analysis tips:
RADII Software Support Tools Development Process
Requirements, Architecture, Design, Implementation and Improvement
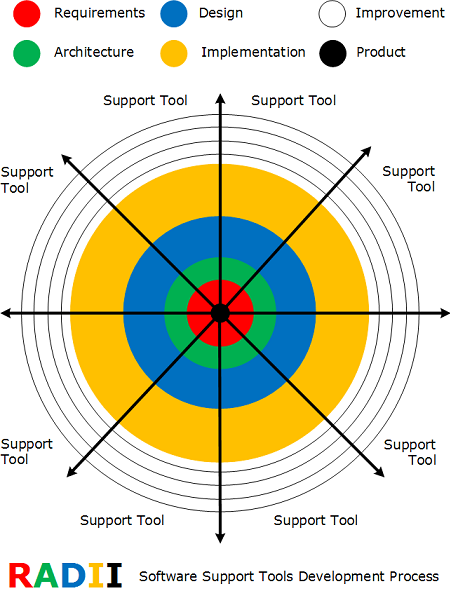
Featured in the forthcoming book: DebugWare: The Art and Craft of Writing Troubleshooting and Debugging Tools
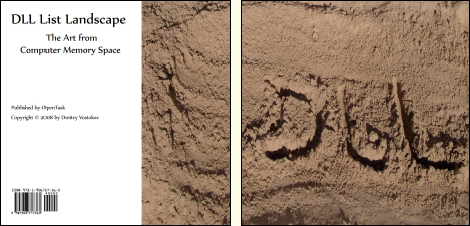
DLL List Landscape: The Art from Computer Memory Space
The following direct links can be used to order the book now:
Buy Paperback from Amazon
Buy Paperback from Barnes & Noble
Buy Paperback from Book Depository
DLL is also a recursive acronym for DLL List Landscape. This full color book features magnificent images from process user space generated by Dump2Picture:
- Title: DLL List Landscape: The Art from Computer Memory Space
- Author: Dmitry Vostokov
- Publisher: Opentask (15 December 2008)
- Language: English
- Product Dimensions: 21.6 x 21.6
- ISBN-13: 978-1-906717-36-0
- Paperback: 16 pages
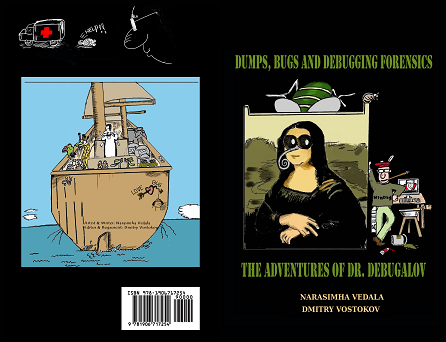
Dumps, Bugs and Debugging Forensics
Finally Dr. Debugalov adventures are imprinted with bugs inside. The full-color book also features never published before cartoons and a few surprises. It sets a new standard for entertainment in software engineering.
The following direct links can be used to order the book now:
Buy Paperback from Amazon
Buy Paperback from Barnes & Noble
Buy Paperback from Book Depository
- Title: Dumps, Bugs and Debugging Forensics: The Adventures of Dr. Debugalov
- Author: Narasimha Vedala
- Editor: Dmitry Vostokov
- Publisher: Opentask (1 December 2008)
- Language: English
- Product Dimensions: 21.6 x 14.0
- ISBN-13: 978-1-906717-25-4
- Paperback: 64 pages
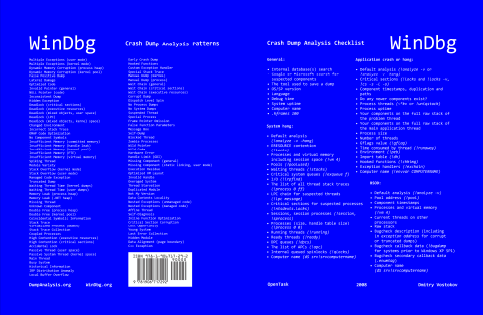
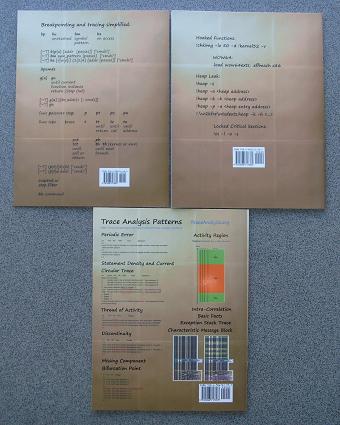
WinDbg: A Reference Poster and Learning Cards
The following direct links can be used to order the book now:
Buy Paperback from Amazon
Buy Paperback from Barnes & Noble
Buy Paperback from Book Depository
WinDbg is a powerful debugger from Microsoft Debugging Tools for Windows. It has more than 350 commands that can be used in different debugging scenarios. The cover of this book is a poster featuring crash dump analysis checklist and common patterns seen in memory dumps and live debugging sessions. Inside the book you can find ready to cut learning cards with commands and their descriptions coloured according to their use for crash dump or live debugging sessions and user, kernel or complete memory dumps. Tossing cards can create unexpected connections between commands and help to learn them more quickly. Uncut pages can also serve as birds eye view to WinDbg debugging capabilities. More than 350 WinDbg commands including meta-commands and extensions are included.
- Title: WinDbg: A Reference Poster and Learning Cards
- Author: Dmitry Vostokov
- Publisher: Opentask (20 November 2008)
- Language: English
- Product Dimensions: 28.0 x 21.6
- ISBN-13: 978-1-906717-29-2
- Paperback: 20 pages