 Multiple Exceptions (user mode) - Modeling Example
 Multiple Exceptions (kernel mode)
 Multiple Exceptions (managed space)
- Multiple Exceptions (stowed)
 Dynamic Memory Corruption (process heap)
 Dynamic Memory Corruption (kernel pool)
- Dynamic Memory Corruption (managed heap)
 False Positive Dump
 Lateral Damage (general)
- Lateral Damage (CPU mode)
 Optimized Code (function parameter reuse)
 Invalid Pointer (general)
- Invalid Pointer (objects)
 NULL Pointer (code)
 NULL Pointer (data)
 Inconsistent Dump
 Hidden Exception (user space)
- Hidden Exception (kernel space)
- Hidden Exception (managed space)
 Deadlock (critical sections)
 Deadlock (executive resources)
 Deadlock (mixed objects, user space)
 Deadlock (LPC)
 Deadlock (mixed objects, kernel space)
 Deadlock (self)
- Deadlock (managed space)
- Deadlock (.NET Finalizer)
 Changed Environment
 Incorrect Stack Trace
 OMAP Code Optimization
 No Component Symbols
 Insufficient Memory (committed memory)
 Insufficient Memory (handle leak)
 Insufficient Memory (kernel pool)
 Insufficient Memory (PTE)
 Insufficient Memory (module fragmentation)
 Insufficient Memory (physical memory)
 Insufficient Memory (control blocks)
- Insufficient Memory (reserved virtual memory)
- Insufficient Memory (session pool)
- Insufficient Memory (stack trace database)
- Insufficient Memory (region)
- Insufficient Memory (stack)
 Spiking Thread
 Module Variety
 Stack Overflow (kernel mode)
 Stack Overflow (user mode)
 Stack Overflow (software implementation)
- Stack Overflow (insufficient memory)
- Stack Overflow (managed space)
 Managed Code Exception
- Managed Code Exception (Scala)
- Managed Code Exception (Python)
 Truncated Dump
 Waiting Thread Time (kernel dumps)
 Waiting Thread Time (user dumps)
 Memory Leak (process heap) - Modeling Example
 Memory Leak (.NET heap)
- Memory Leak (page tables)
- Memory Leak (I/O completion packets)
- Memory Leak (regions)
 Missing Thread (user space)
- Missing Thread (kernel space)
 Unknown Component
 Double Free (process heap)
 Double Free (kernel pool)
 Coincidental Symbolic Information
 Stack Trace
- Stack Trace (I/O request)
- Stack Trace (file system filters)
- Stack Trace (database)
- Stack Trace (I/O devices)
 Virtualized Process (WOW64)
- Virtualized Process (ARM64EC and CHPE)
 Stack Trace Collection (unmanaged space)
- Stack Trace Collection (managed space)
- Stack Trace Collection (predicate)
- Stack Trace Collection (I/O requests)
- Stack Trace Collection (CPUs)
 Coupled Processes (strong)
 Coupled Processes (weak)
 Coupled Processes (semantics)
 High Contention (executive resources)
 High Contention (critical sections)
 High Contention (processors)
- High Contention (.NET CLR monitors)
- High Contention (.NET heap)
- High Contention (sockets)
 Accidental Lock
 Passive Thread (user space)
 Passive System Thread (kernel space)
 Main Thread
 Busy System
 Historical Information
 Object Distribution Anomaly (IRP)
- Object Distribution Anomaly (.NET heap)
 Local Buffer Overflow (user space)
- Local Buffer Overflow (kernel space)
 Early Crash Dump
 Hooked Functions (user space)
 Hooked Functions (kernel space)
- Hooked Modules
 Custom Exception Handler (user space)
 Custom Exception Handler (kernel space)
 Special Stack Trace
 Manual Dump (kernel)
 Manual Dump (process)
 Wait Chain (general)
 Wait Chain (critical sections)
 Wait Chain (executive resources)
 Wait Chain (thread objects)
 Wait Chain (LPC/ALPC)
 Wait Chain (process objects)
 Wait Chain (RPC)
 Wait Chain (window messaging)
 Wait Chain (named pipes)
- Wait Chain (mutex objects)
- Wait Chain (pushlocks)
- Wait Chain (CLR monitors)
- Wait Chain (RTL_RESOURCE)
- Wait Chain (modules)
- Wait Chain (nonstandard synchronization)
- Wait Chain (C++11, condition variable)
- Wait Chain (SRW lock)
 Corrupt Dump
 Dispatch Level Spin
 No Process Dumps
 No System Dumps
 Suspended Thread
 Special Process
 Frame Pointer Omission
 False Function Parameters
 Message Box
 Self-Dump
 Blocked Thread (software)
 Blocked Thread (hardware)
- Blocked Thread (timeout)
 Zombie Processes
 Wild Pointer
 Wild Code
 Hardware Error
 Handle Limit (GDI, kernel space)
- Handle Limit (GDI, user space)
 Missing Component (general)
 Missing Component (static linking, user mode)
 Execution Residue (unmanaged space, user)
- Execution Residue (unmanaged space, kernel)
- Execution Residue (managed space)
 Optimized VM Layout
- Invalid Handle (general)
- Invalid Handle (managed space)
- Overaged System
- Thread Starvation (realtime priority)
- Thread Starvation (normal priority)
- Duplicated Module
- Not My Version (software)
- Not My Version (hardware)
- Data Contents Locality
- Nested Exceptions (unmanaged code)
- Nested Exceptions (managed code)
- Affine Thread
- Self-Diagnosis (user mode)
- Self-Diagnosis (kernel mode)
- Self-Diagnosis (registry)
- Inline Function Optimization (unmanaged code)
- Inline Function Optimization (managed code)
- Critical Section Corruption
- Lost Opportunity
- Young System
- Last Error Collection
- Hidden Module
- Data Alignment (page boundary)
- C++ Exception
- Divide by Zero (user mode)
- Divide by Zero (kernel mode)
- Swarm of Shared Locks
- Process Factory
- Paged Out Data
- Semantic Split
- Pass Through Function
- JIT Code (.NET)
- JIT Code (Java)
- Ubiquitous Component (user space)
- Ubiquitous Component (kernel space)
- Nested Offender
- Virtualized System
- Effect Component
- Well-Tested Function
- Mixed Exception
- Random Object
- Missing Process
- Platform-Specific Debugger
- Value Deviation (stack trace)
- Value Deviation (structure field)
- Runtime Thread (CLR)
- Runtime Thread (Python, Linux)
- Coincidental Frames
- Fault Context
- Hardware Activity
- Incorrect Symbolic Information
- Message Hooks - Modeling Example
- Coupled Machines
- Abridged Dump
- Exception Stack Trace
- Distributed Spike
- Instrumentation Information
- Template Module
- Invalid Exception Information
- Shared Buffer Overwrite
- Pervasive System
- Problem Exception Handler
- Same Vendor
- Crash Signature
- Blocked Queue (LPC/ALPC)
- Fat Process Dump
- Invalid Parameter (process heap)
- Invalid Parameter (runtime function)
- String Parameter
- Well-Tested Module
- Embedded Comment
- Hooking Level
- Blocking Module
- Dual Stack Trace
- Environment Hint
- Top Module
- Livelock
- Technology-Specific Subtrace (COM interface invocation)
- Technology-Specific Subtrace (dynamic memory)
- Technology-Specific Subtrace (JIT .NET code)
- Technology-Specific Subtrace (COM client call)
- Dialog Box
- Instrumentation Side Effect
- Semantic Structure (PID.TID)
- Directing Module
- Least Common Frame
- Truncated Stack Trace
- Data Correlation (function parameters)
- Data Correlation (CPU times)
- Module Hint
- Version-Specific Extension
- Cloud Environment
- No Data Types
- Managed Stack Trace
- Managed Stack Trace (Scala)
- Managed Stack Trace (Python)
- Coupled Modules
- Thread Age
- Unsynchronized Dumps
- Pleiades
- Quiet Dump
- Blocking File
- Problem Vocabulary
- Activation Context
- Stack Trace Set
- Double IRP Completion
- Caller-n-Callee
- Annotated Disassembly (JIT .NET code)
- Annotated Disassembly (unmanaged code)
- Handled Exception (user space)
- Handled Exception (.NET CLR)
- Handled Exception (kernel space)
- Duplicate Extension
- Special Thread (.NET CLR)
- Hidden Parameter
- FPU Exception
- Module Variable
- System Object
- Value References
- Debugger Bug
- Empty Stack Trace
- Problem Module
- Disconnected Network Adapter
- Network Packet Buildup
- Unrecognizable Symbolic Information
- Translated Exception
- Regular Data
- Late Crash Dump
- Blocked DPC
- Coincidental Error Code
- Punctuated Memory Leak
- No Current Thread
- Value Adding Process
- Activity Resonance
- Stored Exception
- Spike Interval
- Stack Trace Change
- Unloaded Module
- Deviant Module
- Paratext
- Incomplete Session
- Error Reporting Fault
- First Fault Stack Trace
- Frozen Process
- Disk Packet Buildup
- Hidden Process
- Active Thread (Mac OS X)
- Active Thread (Windows)
- Critical Stack Trace
- Handle Leak
- Module Collection
- Module Collection (predicate)
- Deviant Token
- Step Dumps
- Broken Link
- Debugger Omission
- Glued Stack Trace
- Reduced Symbolic Information
- Injected Symbols
- Distributed Wait Chain
- One-Thread Process
- Module Product Process
- Crash Signature Invariant
- Small Value
- Shared Structure
- Thread Cluster
- False Effective Address
- Screwbolt Wait Chain
- Design Value
- Hidden IRP
- Tampered Dump
- Memory Fluctuation (process heap)
- Last Object
- Rough Stack Trace (unmanaged space)
- Rough Stack Trace (managed space)
- Past Stack Trace
- Ghost Thread
- Dry Weight
- Exception Module
- Reference Leak
- Origin Module
- Hidden Call
- Corrupt Structure
- Software Exception
- Crashed Process
- Variable Subtrace
- User Space Evidence
- Internal Stack Trace
- Distributed Exception (managed code)
- Thread Poset
- Stack Trace Surface
- Hidden Stack Trace
- Evental Dumps
- Clone Dump
- Parameter Flow
- Critical Region
- Diachronic Module
- Constant Subtrace
- Not My Thread
- Window Hint
- Place Trace
- Stack Trace Signature
- Relative Memory Leak
- Quotient Stack Trace
- Module Stack Trace
- Foreign Module Frame
- Unified Stack Trace
- Mirror Dump Set
- Memory Fibration
- Aggregated Frames
- Frame Regularity
- Stack Trace Motif
- System Call
- Stack Trace Race
- Hyperdump
- Disassembly Ambiguity
- Exception Reporting Thread
- Active Space
- Subsystem Modules
- Region Profile
- Region Clusters
- Source Stack Trace
- Hidden Stack
- Interrupt Stack
- False Memory
- Frame Trace
- Pointer Cone
- Context Pointer
- Pointer Class
- False Frame
- Procedure Call Chain
- C++ Object
- COM Exception
- Structure Sheaf
- Saved Exception Context (.NET)
- Shared Thread
- Spiking Interrupts
- Structure Field Collection
- Black Box
- Rough Stack Trace Collection (unmanaged space)
- COM Object
- Shared Page
- Exception Collection
- Dereference Nearpoint
- Address Representations
- Near Exception
- Shadow Stack Trace
- Past Process
- Foreign Stack
- Annotated Stack Trace
- Disassembly Summary
- Region Summary
- Analysis Summary
- Region Spectrum
- Normalized Region
- Function Pointer
- Interrupt Stack Collection
- DPC Stack Collection
- Dump Context
- False Local Address
- Encoded Pointer
- Latent Structure
- ISA-Specific Code
11-11-11 11:11:11 Initiatives for 2012 and Beyond
0. The design and development of SPDL (Software Problem Description Language) with a purpose to automatic generation of software troubleshooting tools based on the description of a problem. Please visit this archival link for more details: http://www.dumpanalysis.org/blog/index.php/category/spdl/
1. The design and development of memory-oriented operating system where memory is the foundation of the whole architecture from the ground up. Please visit this archival link for more details: http://www.dumpanalysis.org/blog/index.php/category/memory-os/


Winners of Tell Your Windows Debugging Story 2011 Annual Competition
The second annual competition was held between 7/7/2011 and 8/8/2011 and the following winners were selected (in alphabetical order):
- Jason Copenhaver
sent his "Debugging the Debugger" story
- Philip Hamer
nominated for "Software Hooks" story
- Loren Zhai
submitted his story
All winners will get Memory Dump Analysis Anthology: Color Supplement for Volumes 1-3 and Memory Dump Analysis Anthology: Color Supplement for Volumes 4-5 signed by the author.
Jason Copenhaver was also selected to get the main prize: 5 volumes of Memory Dump Analysis Anthology.
Tell Your Windows Debugging Story or Nominate Someone
Mad about debugging? Join the annual competition by telling your Windows debugging story (*) or nominating a person after 7/7/2011 and before 8/8/2011 (**). This year main prize is 5 volumes of Memory Dump Analysis Anthology + Color Supplement for Volumes 1-3 + Color Supplement for Volumes 4-5 with supplements signed by the author.
Please send your story or nominate someone using this page: http://www.dumpanalysis.org/contact or dmitry dot vostokov at dumpanalysis dot org (if your story is formatted with pictures)
(*) DumpAnalysis.org reserves the right to publish your story (in a modified form if necessary) in OpenTask magazines and books with full credit.
(**) 7/7 and 8/8 are originally proposed Memory Analysts and Debuggers Days.

Winners of 2010 Competition: http://www.dumpanalysis.org/debugging-competition-2010
The Debugging Community Project: The Anthology of Debugging
Useful debugging information, techniques, examples, best practices, tool tips and tricks are scattered across many blogs and websites. It is often hard to find what one is needed for problem resolution. OpenTask publisher plans a multi-volume project tentatively called The Anthology of Debugging to compile the best of independent articles and blog posts into printed and digital volumes. Additional topics of interest to debuggers will include but not limited to internals, disassembling and reverse engineering, source and binary code analysis.
The first volume is projected to be published after this summer (ISBN: 978-1908043276). All potential authors will be contacted for their permission, will retain their copyright and their included articles will point to the original source. Additionally, the participants will have an opportunity to include a short bio and other relevant information.
Webinar The Old New Crash: Cloud Memory Dump Analysis
The first Webinar to start an in-depth discussion of a uniform methodology and tools for analysis of crashes, hangs, and other types of abnormal software behaviour in cloud environments.
![]()
Memory Dump Analysis Services (DumpAnalysis.com) organizes a free Webinar
Date: 13th of June 2011
Time: 18:45 (BST) 13:45 (EST) 10:45 (PST)
Duration: 60 minutes
Topics include:
- What's old
- What's new
- Orbifold memory spaces
- Methodology and best practices
- Cloud-specific patterns
- Hands-on exercises
Prerequisites: working knowledge of basic memory dump analysis or live debugging.
Memory Intelligence Agency
MIA has been established to study and promote intelligence analysis based on trace analysis patterns.
For details please visit our blog.
Software Trace and Memory Dump Analysis: Patterns, Tools, Processes and Best Practices
Presentation of pattern-driven software trace analysis with examples from application and desktop delivery environments at E2E Virtualization Conference (PubForum) in Dublin on 13th of May, 2011.
![]()
Topics include a case study covering simultaneous analysis of software traces and memory dumps. The full transcript with extras will be published afterwards.
StopPages 2011 Victimware Analysis Conference
Virtual event to learn how to analyze blockages, delays, obstructions, preventions, and stoppages!

5 Years of DumpAnalysis.org!

The slide is from a presentation Introduction to Pattern-Driven Software Problem Solving
Webinar: Introduction to Pattern-Driven Software Problem Solving
The first Webinar to start an in-depth discussion of pattern-driven software troubleshooting, debugging and maintenance.
![]()
Memory Dump Analysis Services (DumpAnalysis.com) organizes a free Webinar:
Date: 25th of March 2011
Time: 18:30 (GMT) 14:30 (EST) 11:30 (PST)
Duration: 60 minutes
Topics include:
- A Short History of DumpAnalysis.org
- Memory Dump Analysis Patterns
- Troubleshooting and Debugging Tools (Debugware) Patterns
- Software Trace Analysis Patterns
- From Software Defects to Software Behavior
- Workaround Patterns
- Structural Memory Patterns
- Memory Analysis Domain Pattern Hierarchy
- New Directions
Prerequisites: experience in software troubleshooting and/or debugging
Join Facebook DA+TA Group
This specially designed logo explores the concept of a face as a combination of dump and trace artifacts:
 Group")
Join Facebook DATA (Dump Analysis + Trace Analysis) group: https://www.facebook.com/groups/dumpanalysis/
Encyclopedia of Debugging
We announce the start of the ultimate multi- and cross-platform debugging reference project. Useful for years to come, this encyclopedia would cover all aspects of debugging with articles from leading experts from both industry and academia. Preliminary product information:
- Title: Encyclopedia of Debugging
- Editor: Dmitry Vostokov
- Hardcover: 1200 pages
- Publisher: OpenTask (March 2014)
- ISBN-13: 978-1-908043-12-2
360-Degree Memory Analysis
DumpAnalysis.org portal is looking for a sponsor for the ultimate malware, memory analyst and debugger's desk: monitors joined together to form 360-degree surveillance ring with an analyst in the center.
If you or your company would like to become the sponsor: please use this contact form: http://www.dumpanalysis.org/contact
The Year of Dump Analysis in Retrospection
The Year of Dump Analysis, 0x7DA, was another remarkable year for DumpAnalysis.org. Here is the list of major achievements to report:
- Proposed software narratological framework
- Extended the concept of multithreading with adjoint threading
- After recognizing victimware as a counterpart to crimeware established Victimware.org (currently points to Memory Dump, Software Trace, Debugging and Malware Analysis Portal)
- Established the Dublin School of Security
- Proposed using category theory for memory dump analysis as an alternative to set-theoretical frameworks
- Made Memory Dump Analysis Anthology available to major universities, Fortune 50 companies, leading training organizations, and libraries worldwide via Safari Books Online
- Secured the first Memory Dump Analysis Audit Service and its subsidiary Tool Objects: Unified Troubleshooting and Debugging to become portal sponsors
- Completely redesigned Debugging Experts Magazine Online
- Contributed to two issues of Debugged! MZ/PE magazine: Multithreading and Tools for Software Problem Solving
- Published the 4th volume of Memory Dump Analysis Anthology with color supplement
- Prepared material for the 5th volume of Memory Dump Analysis Anthology (to be published in January, 2011)
- Organized the first Debugging Jokes Competition and the first Tell Your Windows Debugging Story Competition
- Established the Metaphysical Society of Ireland to promote memory dump worldview
- Helped to deliver Fundamentals of Complete Crash and Hang Memory Dump Analysis webinar
- Established the Museum of Debugging and Memory Dumps (the 1st exhibition opens in 2011)
- Introduced Unified Debugging patterns, Workaround patterns and Structural Memory Analysis patterns
- Proposed and organized the first Memory Analysts and Debuggers Day (to be celebrated annually)
- Continued working on CARE research project and published its reference architecture
- Unified memory dump and software trace analysis patterns as software behavior patterns
- Memory Dump Analysis Anthology got international recognition when Korean translation of 1st volume was published.
... and much more including many new memory dump and software trace analysis patterns, pattern icons, pattern models, and pattern-driven analysis case studies.
Happy New Year and Decade of Debugging 0x7DB - 0x7E4!
The New Year of DeBugging 0x7DB opens the DeBugging Decade. Just a few tips and an artwork for the beginning:
How many bugs can you count in the picture above? (Click on the picture to expand)
1: kd>*

1: kd>* Virtual memory search

1: kd>*
1: kd> s-d 0 L?3FFFFFFF 7DB

00000000`777509dc  0000007db 0004c550 0005dd80 0000b610
1: kd>*

1: kd>* Physical memory search for the first 65535 pages

1: kd>*
1: kd> !search 7DB 0 0 FFFF

Searching PFNs in range 0000000000000001 - 000000000000FFFF for [00000000000007DB - 00000000000007DB]
Pfn              Offset   Hit              Va               Pte

- - - - - - - - - - - - - - - - - - - - - - - - - - - - - - - - - - - - - - - - - - - - - - - - -

000000000000041D 00000D10 000000000000075B FFFFF8A000437D10 FFFFF6FC500021B8

	fffff8a00040b000+0x2cd10 : NtFB (LargePool)  -- BitmpSup.c

000000000000045F 00000090 000000000000079B FFFFF8A000439090 FFFFF6FC500021C8

	fffff8a00040b000+0x2e090 : NtFB (LargePool)  -- BitmpSup.c

000000000000045F 00000B40 00000000000007CB FFFFF8A000439B40 FFFFF6FC500021C8

	fffff8a00040b000+0x2eb40 : NtFB (LargePool)  -- BitmpSup.c

000000000000045F 00000D80 00000000000007D3 FFFFF8A000439D80 FFFFF6FC500021C8

	fffff8a00040b000+0x2ed80 : NtFB (LargePool)  -- BitmpSup.c

0000000000000460 000000B0 00000000000007D9 FFFFF8A00043A0B0 FFFFF6FC500021D0

	fffff8a00040b000+0x2f0b0 : NtFB (LargePool)  -- BitmpSup.c

0000000000000460 000000C8 00000000000007DA FFFFF8A00043A0C8 FFFFF6FC500021D0

	fffff8a00040b000+0x2f0c8 : NtFB (LargePool)  -- BitmpSup.c

0000000000000460 000000E0 00000000000007DB FFFFF8A00043A0E0 FFFFF6FC500021D0

	fffff8a00040b000+0x2f0e0 : NtFB (LargePool)  -- BitmpSup.c

0000000000000460 00000218 00000000000007DF FFFFF8A00043A218 FFFFF6FC500021D0

	fffff8a00040b000+0x2f218 : NtFB (LargePool)  -- BitmpSup.c

0000000000000460 00000950 00000000000007FB FFFFF8A00043A950 FFFFF6FC500021D0

	fffff8a00040b000+0x2f950 : NtFB (LargePool)  -- BitmpSup.c

0000000000000494 00000ED8 00000000000006DB FFFFF8A00042EED8 FFFFF6FC50002170

	fffff8a00040b000+0x23ed8 : NtFB (LargePool)  -- BitmpSup.c

00000000000004D0 00000708 00000000000005DB FFFFF8A00042A708 FFFFF6FC50002150

	fffff8a00040b000+0x1f708 : NtFB (LargePool)  -- BitmpSup.c

0000000000000562 000002A0 0000000000000FDB FFFFF8A00043C2A0 FFFFF6FC500021E0

	fffff8a00040b000+0x312a0 : NtFB (LargePool)  -- BitmpSup.c

00000000000005C8 00000020 00000000000003DB FFFFF8A000422020 FFFFF6FC50002110

	fffff8a00040b000+0x17020 : NtFB (LargePool)  -- BitmpSup.c

0000000000000A80 00000F58 00000000000017DB FFFFF8A00041AF58 FFFFF6FC500020D0

	fffff8a00040b000+0xff58  : NtFB (LargePool)  -- BitmpSup.c

0000000000003411 000008E0 00000000000005DB FFFFFA80000118E0 FFFFF6FD40000088

0000000000003411 00000948 00000000000005DB FFFFFA8000011948 FFFFF6FD40000088

0000000000003413 00000D18 000000000000079B FFFFFA8000013D18 FFFFF6FD40000098

0000000000003415 00000510 000000000000079B FFFFFA8000015510 FFFFF6FD400000A8

0000000000003415 00000518 000000000000075B FFFFFA8000015518 FFFFF6FD400000A8

0000000000003416 00000CB8 00000000000007D9 FFFFFA8000016CB8 FFFFF6FD400000B0

0000000000003431 00000110 00000000000017DB FFFFFA8000031110 FFFFF6FD40000188

0000000000003431 00000D10 0000000000000FDB FFFFFA8000031D10 FFFFF6FD40000188

0000000000003449 00000118 00000000000017DB FFFFFA8000049118 FFFFF6FD40000248

0000000000003466 00000218 00000000000007CB FFFFFA8000066218 FFFFF6FD40000330

0000000000003466 000004B0 00000000000007D9 FFFFFA80000664B0 FFFFF6FD40000330

0000000000003466 00000510 000000000000075B FFFFFA8000066510 FFFFF6FD40000330

0000000000003467 00000110 00000000000007DB FFFFFA8000067110 FFFFF6FD40000338

000000000000346B 00000918 00000000000007DB FFFFFA800006B918 FFFFF6FD40000358

0000000000003473 00000260 00000000000005DB FFFFFA8000073260 FFFFF6FD40000398

000000000000349A 00000A10 00000000000007CB FFFFFA800009AA10 FFFFF6FD400004D0

000000000000349B 00000348 00000000000007FB FFFFFA800009B348 FFFFF6FD400004D8

000000000000352C 00000510 00000000000006DB FFFFFA800012C510 FFFFF6FD40000960

000000000000352C 00000AE0 00000000000007FB FFFFFA800012CAE0 FFFFF6FD40000960

0000000000003563 000001D0 00000000000007DF FFFFFA80001631D0 FFFFF6FD40000B18

000000000000356A 00000938 00000000000007DA FFFFFA800016A938 FFFFF6FD40000B50

0000000000003596 00000D10 00000000000087DB FFFFFA8000196D10 FFFFF6FD40000CB0

0000000000003599 00000D18 00000000000087DB FFFFFA8000199D18 FFFFF6FD40000CC8

00000000000035A8 00000738 00000000000007DA FFFFFA80001A8738 FFFFF6FD40000D40

000000000000369B 00000B30 00000000000027DB FFFFFA800029BB30 FFFFF6FD400014D8

00000000000036FE 00000B90 00000000000007D3 FFFFFA80002FEB90 FFFFF6FD400017F0

0000000000003710 00000D10 00000000000107DB FFFFFA8000310D10 FFFFF6FD40001880

0000000000003747 00000918 00000000000107DB FFFFFA8000347918 FFFFF6FD40001A38

00000000000037B9 000009D8 00000000000007DF FFFFFA80003B99D8 FFFFF6FD40001DC8

000000000000380D 00000640 00000000000003DB FFFFFA800040D640 FFFFF6FD40002068

00000000000038D7 00000870 0000000000000FDB FFFFFA80004D7870 FFFFF6FD400026B8

000000000000391B 00000490 0000000000000FDB FFFFFA800051B490 FFFFF6FD400028D8

0000000000003923 000003E0 000000000000075B FFFFFA80005233E0 FFFFF6FD40002918

000000000000392A 000001F0 00000000000007DB FFFFFA800052A1F0 FFFFF6FD40002950

000000000000393C 00000A30 00000000000007FB FFFFFA800053CA30 FFFFF6FD400029E0

0000000000003951 00000BE0 00000000000007D3 FFFFFA8000551BE0 FFFFF6FD40002A88

0000000000003964 00000F00 00000000000007FB FFFFFA8000564F00 FFFFF6FD40002B20

0000000000003980 000004D0 00000000000007CB FFFFFA80005804D0 FFFFF6FD40002C00

000000000000399D 00000900 00000000000007DA FFFFFA800059D900 FFFFF6FD40002CE8

0000000000003A11 00000910 00000000000207DB FFFFFA8000611910 FFFFF6FD40003088

0000000000003A16 00000118 00000000000207DB FFFFFA8000616118 FFFFF6FD400030B0

0000000000003B3E 00000570 00000000000006DB FFFFFA800073E570 FFFFF6FD400039F0

0000000000003D23 000003D0 00000000000006DB FFFFFA80009233D0 FFFFF6FD40004918

0000000000003D32 00000AF0 00000000000007FB FFFFFA8000932AF0 FFFFF6FD40004990

0000000000003D5C 00000580 00000000000007DB FFFFFA800095C580 FFFFF6FD40004AE0

0000000000003D7B 00000150 00000000000007DA FFFFFA800097B150 FFFFF6FD40004BD8

0000000000003D81 00000D20 00000000000007D9 FFFFFA8000981D20 FFFFF6FD40004C08

0000000000003DB9 000009A0 00000000000007DB FFFFFA80009B99A0 FFFFF6FD40004DC8

0000000000003DE7 00000AB0 00000000000007D3 FFFFFA80009E7AB0 FFFFF6FD40004F38

0000000000003DE8 000001D0 00000000000007D9 FFFFFA80009E81D0 FFFFF6FD40004F40

0000000000003F29 00000410 00000000000006DB FFFFFA8000B29410 FFFFF6FD40005948

0000000000003FA5 00000918 00000000000407DB FFFFFA8000BA5918 FFFFF6FD40005D28

000000000000401C 00000110 00000000000407DB FFFFFA8000C1C110 FFFFF6FD400060E0

000000000000443D 00000580 00000000000007FB FFFFFA800103D580 FFFFF6FD400081E8

0000000000004502 000006B0 000000000000079B FFFFFA80011026B0 FFFFF6FD40008810

000000000000456B 00000BF0 00000000000007DF FFFFFA800116BBF0 FFFFF6FD40008B58

0000000000004577 00000B90 000000000000075B FFFFFA8001177B90 FFFFF6FD40008BB8

00000000000046B7 00000330 00000000000007CB FFFFFA80012B7330 FFFFF6FD400095B8

0000000000004819 00000F90 00000000000007DB FFFFFA8001419F90 FFFFF6FD4000A0C8

0000000000004A62 00000930 00000000000003DB FFFFFA8001662930 FFFFF6FD4000B310

0000000000004AA2 00000C20 00000000000006DB FFFFFA80016A2C20 FFFFF6FD4000B510

0000000000004AB6 00000870 00000000000007FB FFFFFA80016B6870 FFFFF6FD4000B5B0

0000000000004ABB 000007C0 000000000000079B FFFFFA80016BB7C0 FFFFF6FD4000B5D8

0000000000004AD5 000003E0 00000000000007DA FFFFFA80016D53E0 FFFFF6FD4000B6A8

0000000000004BAA 00000560 00000000000007D3 FFFFFA80017AA560 FFFFF6FD4000BD50

0000000000004BE5 00000570 00000000000007CB FFFFFA80017E5570 FFFFF6FD4000BF28

0000000000004C18 00000510 00000000000807DB FFFFFA8001818510 FFFFF6FD4000C0C0

0000000000004C19 00000118 00000000000807DB FFFFFA8001819118 FFFFF6FD4000C0C8

0000000000004C1F 00000530 00000000000107DB FFFFFA800181F530 FFFFF6FD4000C0F8

0000000000004CAB 00000750 000000000000079B FFFFFA80018AB750 FFFFF6FD4000C558

0000000000004CB3 00000AF0 00000000000007D3 FFFFFA80018B3AF0 FFFFF6FD4000C598

0000000000005061 000002E0 000000000000075B FFFFFA8001C612E0 FFFFF6FD4000E308

0000000000005291 00000F80 00000000000006DB FFFFFA8001E91F80 FFFFF6FD4000F488

00000000000052B7 00000E70 00000000000027DB FFFFFA8001EB7E70 FFFFF6FD4000F5B8

0000000000005314 00000630 00000000000007DB FFFFFA8001F14630 FFFFF6FD4000F8A0

000000000000531D 00000630 000000000000079B FFFFFA8001F1D630 FFFFF6FD4000F8E8

0000000000005336 00000230 00000000000005DB FFFFFA8001F36230 FFFFF6FD4000F9B0

000000000000533E 00000660 00000000000006DB FFFFFA8001F3E660 FFFFF6FD4000F9F0

0000000000005343 00000550 0000000000000FDB FFFFFA8001F43550 FFFFF6FD4000FA18

0000000000005384 00000E60 00000000000007DA FFFFFA8001F84E60 FFFFF6FD4000FC20

00000000000053F1 00000820 00000000000007DA FFFFFA8001FF1820 FFFFF6FD4000FF88

00000000000053F1 00000BB0 00000000000003DB FFFFFA8001FF1BB0 FFFFF6FD4000FF88

00000000000053FF 00000C80 00000000000007D9 FFFFFA8001FFFC80 FFFFF6FD4000FFF8

0000000000005428 00000C00 00000000000007DA FFFFFA8002028C00 FFFFF6FD40010140

000000000000542D 00000DC0 00000000000007FB FFFFFA800202DDC0 FFFFF6FD40010168

0000000000005456 00000800 0000000000000FDB FFFFFA8002056800 FFFFF6FD400102B0

0000000000005459 00000CB0 00000000000006DB FFFFFA8002059CB0 FFFFF6FD400102C8

000000000000546B 00000B30 00000000000003DB FFFFFA800206BB30 FFFFF6FD40010358

000000000000547F 00000450 00000000000005DB FFFFFA800207F450 FFFFF6FD400103F8

000000000000549E 00000290 00000000000087DB FFFFFA800209E290 FFFFF6FD400104F0

000000000000551C 00000410 00000000000003DB FFFFFA800211C410 FFFFF6FD400108E0

000000000000563E 00000510 000000000000075B FFFFFA800223E510 FFFFF6FD400111F0

000000000000567C 00000FD0 00000000000007DF FFFFFA800227CFD0 FFFFF6FD400113E0

0000000000005731 000002A0 00000000000017DB FFFFFA80023312A0 FFFFF6FD40011988

000000000000575A 00000400 00000000000007FB FFFFFA800235A400 FFFFF6FD40011AD0

0000000000005847 00000400 00000000000003DB FFFFFA8003047400 FFFFF6FD40018238

000000000000588E 00000290 00000000000007D9 FFFFFA800308E290 FFFFF6FD40018470

0000000000005890 00000C60 000000000000075B FFFFFA8003090C60 FFFFF6FD40018480

0000000000005893 00000F90 00000000000005DB FFFFFA8003093F90 FFFFF6FD40018498

000000000000589B 000006D0 00000000000006DB FFFFFA800309B6D0 FFFFF6FD400184D8

00000000000058A5 000009C0 000000000000079B FFFFFA80030A59C0 FFFFF6FD40018528

00000000000058AA 000008B0 00000000000017DB FFFFFA80030AA8B0 FFFFF6FD40018550

00000000000058BC 00000400 00000000000003DB FFFFFA80030BC400 FFFFF6FD400185E0

0000000000005911 000002A0 00000000000007D3 FFFFFA80031112A0 FFFFF6FD40018888

0000000000005957 00000A40 00000000000005DB FFFFFA8003157A40 FFFFF6FD40018AB8

0000000000005995 00000E40 00000000000003DB FFFFFA8003195E40 FFFFF6FD40018CA8

000000000000599D 00000AF0 0000000000000FDB FFFFFA800319DAF0 FFFFF6FD40018CE8

00000000000059AD 000002A0 00000000000007DF FFFFFA80031AD2A0 FFFFF6FD40018D68

00000000000059B2 00000910 00000000000007DF FFFFFA80031B2910 FFFFF6FD40018D90

00000000000059D0 00000520 00000000000003DB FFFFFA80031D0520 FFFFF6FD40018E80

00000000000059E1 000003B0 00000000000007FB FFFFFA80031E13B0 FFFFF6FD40018F08

00000000000059E7 00000D10 00000000000007D3 FFFFFA80031E7D10 FFFFF6FD40018F38

00000000000059EC 00000690 00000000000007CB FFFFFA80031EC690 FFFFF6FD40018F60

00000000000059FB 000003C0 00000000000005DB FFFFFA80031FB3C0 FFFFF6FD40018FD8

00000000000059FB 00000FF0 00000000000005DB FFFFFA80031FBFF0 FFFFF6FD40018FD8

00000000000059FE 000003C0 00000000000006DB FFFFFA80031FE3C0 FFFFF6FD40018FF0

0000000000005A01 000003C0 00000000000007DA FFFFFA80032013C0 FFFFF6FD40019008

0000000000005A0A 000003F0 00000000000007D9 FFFFFA800320A3F0 FFFFF6FD40019050

0000000000005A0D 00000390 000000000000075B FFFFFA800320D390 FFFFF6FD40019068

0000000000005A0D 00000960 00000000000007FB FFFFFA800320D960 FFFFF6FD40019068

0000000000005A0D 00000F90 000000000000079B FFFFFA800320DF90 FFFFF6FD40019068

0000000000005A0E 000003B0 00000000000007FB FFFFFA800320E3B0 FFFFF6FD40019070

0000000000005A0E 00000B90 00000000000007DB FFFFFA800320EB90 FFFFF6FD40019070

0000000000005A0F 000006D0 00000000000007DF FFFFFA800320F6D0 FFFFF6FD40019078

0000000000005A11 00000080 00000000000003DB FFFFFA8003211080 FFFFF6FD40019088

0000000000005A19 000006F0 0000000000000FDB FFFFFA80032196F0 FFFFF6FD400190C8

0000000000005A31 00000930 00000000000006DB FFFFFA8003231930 FFFFF6FD40019188

0000000000005A47 00000560 00000000000017DB FFFFFA8003247560 FFFFF6FD40019238

0000000000005A7E 000002B0 00000000000017DB FFFFFA800327E2B0 FFFFF6FD400193F0

0000000000005ADC 00000480 00000000000003DB FFFFFA80032DC480 FFFFF6FD400196E0

0000000000005ADC 00000630 0000000000000FDB FFFFFA80032DC630 FFFFF6FD400196E0

0000000000005AF1 00000180 00000000000007D3 FFFFFA80032F1180 FFFFF6FD40019788

0000000000005AF5 00000B00 0000000000000FDB FFFFFA80032F5B00 FFFFF6FD400197A8

0000000000005AFA 00000630 00000000000003DB FFFFFA80032FA630 FFFFF6FD400197D0

0000000000005AFE 00000890 0000000000000FDB FFFFFA80032FE890 FFFFF6FD400197F0

0000000000005AFE 00000D10 00000000000007D9 FFFFFA80032FED10 FFFFF6FD400197F0

0000000000005B12 00000F30 00000000000007FB FFFFFA8003312F30 FFFFF6FD40019890

0000000000005B1F 00000680 00000000000007CB FFFFFA800331F680 FFFFF6FD400198F8

0000000000005B25 00000F20 00000000000003DB FFFFFA8003325F20 FFFFF6FD40019928

0000000000005B25 00000FE0 00000000000007DF FFFFFA8003325FE0 FFFFF6FD40019928

0000000000005B28 000005F0 00000000000007D3 FFFFFA80033285F0 FFFFF6FD40019940

0000000000005B33 00000DB0 000000000000075B FFFFFA8003333DB0 FFFFF6FD40019998

0000000000005B35 000005B0 00000000000006DB FFFFFA80033355B0 FFFFF6FD400199A8

0000000000005B39 00000120 000000000000075B FFFFFA8003339120 FFFFF6FD400199C8

0000000000005B3A 000006B0 00000000000007DB FFFFFA800333A6B0 FFFFF6FD400199D0

0000000000005B47 00000E50 000000000000079B FFFFFA8003347E50 FFFFF6FD40019A38

0000000000005B55 00000FE0 000000000000079B FFFFFA8003355FE0 FFFFF6FD40019AA8

0000000000005B5A 00000390 00000000000006DB FFFFFA800335A390 FFFFF6FD40019AD0

0000000000005B6B 00000310 00000000000006DB FFFFFA800336B310 FFFFF6FD40019B58

0000000000005BF4 00000200 00000000000027DB FFFFFA80033F4200 FFFFF6FD40019FA0

0000000000005CA3 00000250 00000000000007DF FFFFFA80034A3250 FFFFF6FD4001A518

0000000000005CB0 00000F90 00000000000007DA FFFFFA80034B0F90 FFFFF6FD4001A580

0000000000005CC1 00000310 00000000000003DB FFFFFA80034C1310 FFFFF6FD4001A608

0000000000005D06 00000130 00000000000005DB FFFFFA8003506130 FFFFF6FD4001A830

0000000000005D0E 00000170 00000000000003DB FFFFFA800350E170 FFFFF6FD4001A870

0000000000005D2B 00000330 00000000000007DF FFFFFA800352B330 FFFFF6FD4001A958

0000000000005D30 00000EB0 00000000000007D3 FFFFFA8003530EB0 FFFFF6FD4001A980

0000000000005D33 000003D0 00000000000007D9 FFFFFA80035333D0 FFFFF6FD4001A998

0000000000005D38 00000830 00000000000007DB FFFFFA8003538830 FFFFF6FD4001A9C0

0000000000005D3E 00000980 00000000000007CB FFFFFA800353E980 FFFFF6FD4001A9F0

0000000000005D42 00000700 000000000000075B FFFFFA8003542700 FFFFF6FD4001AA10

0000000000005D47 00000E60 00000000000007D3 FFFFFA8003547E60 FFFFF6FD4001AA38

0000000000005D4E 000002B0 00000000000007FB FFFFFA800354E2B0 FFFFF6FD4001AA70

0000000000005D4F 000008D0 00000000000007DF FFFFFA800354F8D0 FFFFF6FD4001AA78

0000000000005D55 00000030 00000000000007DB FFFFFA8003555030 FFFFF6FD4001AAA8

0000000000005D58 000002A0 00000000000007DF FFFFFA80035582A0 FFFFF6FD4001AAC0

0000000000005D67 00000060 00000000000007D3 FFFFFA8003567060 FFFFF6FD4001AB38

0000000000005D81 000006D0 000000000000075B FFFFFA80035816D0 FFFFF6FD4001AC08

0000000000005D86 00000BF0 00000000000006DB FFFFFA8003586BF0 FFFFF6FD4001AC30

0000000000005D87 00000670 00000000000005DB FFFFFA8003587670 FFFFF6FD4001AC38

0000000000005D87 00000700 00000000000007CB FFFFFA8003587700 FFFFF6FD4001AC38

0000000000005D96 00000B50 00000000000003DB FFFFFA8003596B50 FFFFF6FD4001ACB0

0000000000005DA4 00000290 00000000000005DB FFFFFA80035A4290 FFFFF6FD4001AD20

0000000000005DBF 000005C0 00000000000007D3 FFFFFA80035BF5C0 FFFFF6FD4001ADF8

0000000000005DC6 00000F10 00000000000003DB FFFFFA80035C6F10 FFFFF6FD4001AE30

0000000000005DCF 00000B20 00000000000007D3 FFFFFA80035CFB20 FFFFF6FD4001AE78

0000000000005DD6 00000CF0 00000000000007DB FFFFFA80035D6CF0 FFFFF6FD4001AEB0

0000000000005DDC 00000FF0 00000000000007DF FFFFFA80035DCFF0 FFFFF6FD4001AEE0

0000000000005DEF 00000B90 000000000000075B FFFFFA80035EFB90 FFFFF6FD4001AF78

0000000000005DF1 00000CC0 000000000000079B FFFFFA80035F1CC0 FFFFF6FD4001AF88

0000000000005E03 00000F30 00000000000005DB FFFFFA8003603F30 FFFFF6FD4001B018

0000000000005E12 00000F60 00000000000005DB FFFFFA8003612F60 FFFFF6FD4001B090

0000000000005E13 00000890 00000000000003DB FFFFFA8003613890 FFFFF6FD4001B098

0000000000005E18 00000E10 000000000000075B FFFFFA8003618E10 FFFFF6FD4001B0C0

0000000000005E1A 00000100 00000000000007CB FFFFFA800361A100 FFFFF6FD4001B0D0

0000000000005E38 00000310 000000000000075B FFFFFA8003638310 FFFFF6FD4001B1C0

0000000000005E41 00000820 00000000000007DB FFFFFA8003641820 FFFFF6FD4001B208

0000000000005E54 00000C90 00000000000005DB FFFFFA8003654C90 FFFFF6FD4001B2A0

0000000000005E63 000005D0 00000000000007CB FFFFFA80036635D0 FFFFF6FD4001B318

0000000000005E67 00000680 00000000000005DB FFFFFA8003667680 FFFFF6FD4001B338

0000000000005E73 000009E0 000000000000075B FFFFFA80036739E0 FFFFF6FD4001B398

0000000000005E7E 000007E0 00000000000007CB FFFFFA800367E7E0 FFFFF6FD4001B3F0

0000000000005E82 00000C20 00000000000007DF FFFFFA8003682C20 FFFFF6FD4001B410

0000000000005E84 00000360 00000000000007D9 FFFFFA8003684360 FFFFF6FD4001B420

0000000000005E84 00000FC0 00000000000007DB FFFFFA8003684FC0 FFFFF6FD4001B420

0000000000005E85 000002C0 00000000000006DB FFFFFA80036852C0 FFFFF6FD4001B428

0000000000005E8C 00000C70 00000000000007FB FFFFFA800368CC70 FFFFF6FD4001B460

0000000000005E8C 00000F40 00000000000007D3 FFFFFA800368CF40 FFFFF6FD4001B460

0000000000005E90 00000F90 00000000000007DA FFFFFA8003690F90 FFFFF6FD4001B480

0000000000005E91 00000530 00000000000003DB FFFFFA8003691530 FFFFF6FD4001B488

0000000000005E9B 00000190 000000000000079B FFFFFA800369B190 FFFFF6FD4001B4D8

0000000000005E9B 000003A0 000000000000075B FFFFFA800369B3A0 FFFFF6FD4001B4D8

0000000000005E9E 00000460 00000000000007DA FFFFFA800369E460 FFFFF6FD4001B4F0

0000000000005EA7 00000E50 00000000000003DB FFFFFA80036A7E50 FFFFF6FD4001B538

0000000000005EAF 00000080 00000000000005DB FFFFFA80036AF080 FFFFF6FD4001B578

0000000000005EB9 00000250 00000000000007DA FFFFFA80036B9250 FFFFF6FD4001B5C8

0000000000005EBB 000005C0 00000000000003DB FFFFFA80036BB5C0 FFFFF6FD4001B5D8

0000000000005EC4 00000770 00000000000003DB FFFFFA80036C4770 FFFFF6FD4001B620

0000000000005EC5 00000DC0 00000000000007D3 FFFFFA80036C5DC0 FFFFF6FD4001B628

0000000000005ECA 00000E60 00000000000003DB FFFFFA80036CAE60 FFFFF6FD4001B650

0000000000005ECC 000003C0 000000000000075B FFFFFA80036CC3C0 FFFFF6FD4001B660

0000000000005ECD 00000C20 00000000000007DA FFFFFA80036CDC20 FFFFF6FD4001B668

0000000000005EE9 000004F0 00000000000003DB FFFFFA80036E94F0 FFFFF6FD4001B748

0000000000005EF2 000007C0 00000000000006DB FFFFFA80036F27C0 FFFFF6FD4001B790

0000000000005F05 00000E10 00000000000007CB FFFFFA8003705E10 FFFFF6FD4001B828

0000000000005F07 00000A60 00000000000007D9 FFFFFA8003707A60 FFFFF6FD4001B838

0000000000005F08 00000150 00000000000007FB FFFFFA8003708150 FFFFF6FD4001B840

0000000000005F09 00000710 00000000000005DB FFFFFA8003709710 FFFFF6FD4001B848

0000000000005F17 00000600 00000000000005DB FFFFFA8003717600 FFFFF6FD4001B8B8

0000000000005F1D 00000990 00000000000007DF FFFFFA800371D990 FFFFF6FD4001B8E8

0000000000005F2C 00000E40 00000000000007DA FFFFFA800372CE40 FFFFF6FD4001B960

0000000000005F2D 000001D0 00000000000007DF FFFFFA800372D1D0 FFFFF6FD4001B968

0000000000005F2F 00000EA0 00000000000007D9 FFFFFA800372FEA0 FFFFF6FD4001B978

0000000000005F3F 000008F0 00000000000003DB FFFFFA800373F8F0 FFFFF6FD4001B9F8

0000000000005F57 00000860 00000000000006DB FFFFFA8003757860 FFFFF6FD4001BAB8

0000000000005F59 000001B0 00000000000007CB FFFFFA80037591B0 FFFFF6FD4001BAC8

0000000000005F59 00000A50 00000000000005DB FFFFFA8003759A50 FFFFF6FD4001BAC8

0000000000005F60 00000620 00000000000003DB FFFFFA8003760620 FFFFF6FD4001BB00

0000000000005F63 00000AD0 000000000000075B FFFFFA8003763AD0 FFFFF6FD4001BB18

0000000000005F70 00000790 00000000000007DF FFFFFA8003770790 FFFFF6FD4001BB80

0000000000005F77 000001E0 00000000000007CB FFFFFA80037771E0 FFFFF6FD4001BBB8

0000000000005F80 00000B70 000000000000079B FFFFFA8003780B70 FFFFF6FD4001BC00

0000000000005F97 00000070 00000000000007D3 FFFFFA8003797070 FFFFF6FD4001BCB8

0000000000005FDF 00000550 00000000000007CB FFFFFA80037DF550 FFFFF6FD4001BEF8

0000000000005FF4 000000D0 00000000000007D9 FFFFFA80037F40D0 FFFFF6FD4001BFA0

0000000000006008 00000410 00000000000017DB FFFFFA8003808410 FFFFF6FD4001C040

0000000000006035 00000BF0 00000000000027DB FFFFFA8003835BF0 FFFFF6FD4001C1A8

0000000000006099 00000C10 00000000000047DB FFFFFA8003899C10 FFFFF6FD4001C4C8

00000000000060B8 00000518 0000000000000FDB FFFFFA80038B8518 FFFFF6FD4001C5C0

000000000000613B 00000918 00000000000006DB FFFFFA800393B918 FFFFF6FD4001C9D8

0000000000006153 00000798 00000000000007D3 FFFFFA8003953798 FFFFF6FD4001CA98

000000000000617B 00000F30 0000000000000FDB FFFFFA800397BF30 FFFFF6FD4001CBD8

0000000000006192 00000580 00000000000007DA FFFFFA8003992580 FFFFF6FD4001CC90

0000000000006193 00000180 000000000000079B FFFFFA8003993180 FFFFF6FD4001CC98

0000000000006193 00000D50 00000000000007D9 FFFFFA8003993D50 FFFFF6FD4001CC98

0000000000006194 000009B0 00000000000007DB FFFFFA80039949B0 FFFFF6FD4001CCA0

0000000000006195 00000550 000000000000075B FFFFFA8003995550 FFFFF6FD4001CCA8

0000000000006195 00000670 00000000000007DF FFFFFA8003995670 FFFFF6FD4001CCA8

0000000000006196 00000D50 00000000000006DB FFFFFA8003996D50 FFFFF6FD4001CCB0

0000000000006197 000003B0 00000000000007FB FFFFFA80039973B0 FFFFF6FD4001CCB8

000000000000619A 00000830 00000000000007D3 FFFFFA800399A830 FFFFF6FD4001CCD0

000000000000619B 000002B0 00000000000007CB FFFFFA800399B2B0 FFFFF6FD4001CCD8

00000000000061A9 000003E0 00000000000005DB FFFFFA80039A93E0 FFFFF6FD4001CD48

00000000000061A9 00000D70 00000000000003DB FFFFFA80039A9D70 FFFFF6FD4001CD48

00000000000061B7 00000090 000000000000079B FFFFFA80039B7090 FFFFF6FD4001CDB8

00000000000061BF 00000610 00000000000003DB FFFFFA80039BF610 FFFFF6FD4001CDF8

0000000000007D32 00000EC8 00000000000003DB 000000007790BEC8 FFFFF680003BC858

0000000000009513 00000EC8 00000000000003DB 000000007790BEC8 FFFFF680003BC858

000000000000C631 00000EC8 00000000000003DB 000000007790BEC8 FFFFF680003BC858

000000000000EA70 00000E08 00000000000003DB 0000000000000000 FFFFF8A0099382D8

000000000000EBA3 00000AB0 000000000000075B 0000000000000000 FFFFF8A009938E70

000000000000ED2A 00000E20 00000000000007D9 0000000000000000 FFFFF8A009938EA8

000000000000F4B6 00000BB8 00000000000007D9 0000000000000000 FFFFF8A009938F08

000000000000FCB6 000000C0 00000000020007DB 0000000000000000 FFFFF8A009938D08

000000000000FCE6 00000CF0 00000000000005DB 0000000000000000 FFFFF8A009938E88

000000000000FDE6 00000D90 00000000000007D9 000000000CB3CD90 FFFFF680000659E0

Search done.
Follow the Twitter Trace
This specially designed logo explores the concept of Twitter message stream as a software (t)race:

Follow DumpAnalysis @ Twitter: http://twitter.com/DumpAnalysis
Memory Analysis as a Service
MAaaS includes 2 complementary DA+TA services:
1. Dump Analysis as a Service (DAaaS)
2. Trace Analysis as a Service (TAaaS)
Memory Dump Analysis Services is the first organization to provide such a service at an audit and certification levels.
Crash and Hang Analysis Audit Service
Problem: You are not satisfied with a crash report.
Problem: Your critical issue is escalated to the VP level. Engineers analyze memory dumps and software traces. No definite conclusion so far. You want to be sure that nothing has been omitted from the analysis.
Problem: You analyze a system dump or a software trace. You need a second pair of eyes but don't want to send your memory dump due to your company security policies.
Problem: You are a novice and need expert pattern-driven analysis of your crash and hang memory dump files or debugger logs.
Resolution: Memory Dump Analysis Services analyzes your analysis and provides recommendations.
Prices and service level agreements
/*** Adding AI. Analysis Improvement. ***/
Debugging Joke Competition
As the Year of Dump Analysis 0x7DA (2010) comes closer to the end and the DeBugging decade starts 0x7DB (2011) soon we organize Debugging Joke Competition with the results announced on the 1st of January, 2011 (if Internet works). Please send your jokes using this contact form:
http://www.dumpanalysis.org/contact
Winners get signed (by Dr. DebugLove) copies of Dr. Debugalov book and the forthcoming full color coffee table book Spikes, Hangs, Crashes, Leaks and Dumps of Imagination: The Art of the Debugging Art.
Update: The rules have been extended to include graphical jokes and pictures!
In addition appropriate images may also be included with full credits in the forthcoming Debugging Humor exhibition in the Museum of Debugging and Memory Dumps.
The New Journey of The Software Professional
Having spent 16 years in software engineering the founder of this portal ventured into software support in 2003 (with 8th year started at the time of this writing). Now it is time for the next gradual shift into software security (the domain the founder previously had exposure to but not as a primary focus):
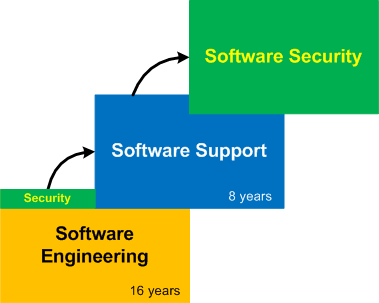
Dublin School of Security
We established the new school of security that includes general memory dump and software trace analysis as a foundation. Everyone is welcome to join! We decided to keep the same DA+TA Facebook group and affiliate it with the school to facilitate unification and one point of access.

We Detour for MARS Expedition!
Welcome to the project MARS (Malware Analysis Report System). It is based on years of research in pattern-driven memory dump and software trace analysis of abnormal software behaviour.
Forthcoming Book: Malware Analysis Patterns
As a practical example of applying behavioral and structural pattern analysis of computer memory and traces OpenTask plans to publish the following title:
- Title: Malware Patterns: Structure and Behavior of Computer Adware, Crimeware, Rootkits, Scareware, Spyware, Trojans, Viruses, Victimware and Worms
- Author: Dmitry Vostokov
- Paperback: 1200 pages
- Publisher: OpenTask (October 2011)
- ISBN-13: 978-1-908043-01-6
CV as a Book
The 2nd edition is coming:
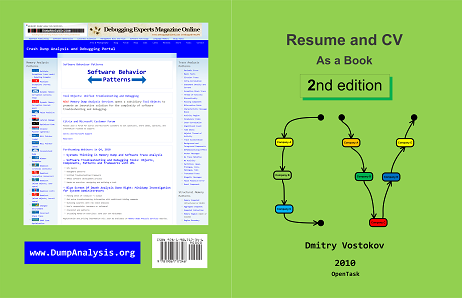
- Title: Resume and CV: As a Book (2nd Edition)
- Author: Dmitry Vostokov
- Paperback: 32 pages
- Publisher: OpenTask (December 2010)
- ISBN-13: 978-1-908043-00-9
The following direct links can be used to order the first edition now:
Buy from Kindle or Paperback
 from Amazon
Buy from Paperback from Barnes & Noble
Buy Paperback from Book Depository
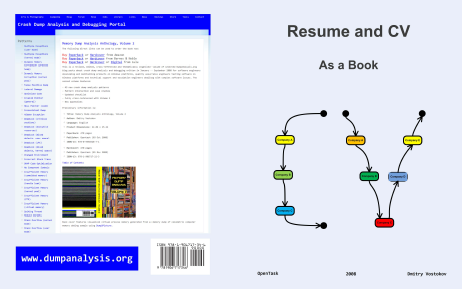
A book can serve the role of CV but a CV can serve the role of a book. This is an old CV (1987 - 2003) from the founder of DumpAnalysis.org as an example of a person with CV-writing obsession.
- Title: Resume and CV: As a Book
- Author: Dmitry Vostokov
- Publisher: Opentask (01 December 2008)
- Language: English
- Product Dimensions: 28.0 x 21.6
- ISBN-13: 978-1-906717-34-6
- Paperback: 20 pages
Tool Objects: Unified Troubleshooting and Debugging
Memory Dump Analysis Services opens a subsidiary Tool Objects to promote an innovative solution for the complexity of software troubleshooting and debugging.
Forthcoming Webinars in Q4, 2010
- Systems Thinking in Memory Dump and Software Trace Analysis
- Software Troubleshooting and Debugging Tools: Objects, Components, Patterns and Frameworks with UML
- UML basics
- DebugWare patterns
- Unified Troubleshooting Framework
- RADII software development process
- Hands-on exercise: designing and building a tool
- Blue Screen Of Death Analysis Done Right: Minidump Investigation for System Administrators
- Making sense of !analyze –v output
- Get extra troubleshooting information with additional WinDbg commands
- Guessing culprits with raw stack analysis
- Who’s responsible: hardware or software?
- Checklist and patterns
- Including hands-on exercises: send your own minidumps
Registration and pricing information will soon be available on Memory Dump Analysis Services website.
Winners of Tell Your Windows Debugging Story 2010 Annual Competition
The first annual competition was held between 7/7/2010 and 8/8/2010 and the following winners were selected (in alphabetical order):
- Tavis Ormandy
nominated for "windows" story: https://docs.google.com/View?id=dfqd62nk_228h28szgz
- Andrey Permamedov
selected entries from "Diary of war with bugs": http://bugswar.blogspot.com
- Sathish Venkataraman
sent the tough enterprise debugging story: to be published in the next issue of Debugged! magazine
All winners will get 3 volumes of Memory Dump Analysis Anthology + Color Supplement all signed by the author.