 Multiple Exceptions (user mode) - Modeling Example
 Multiple Exceptions (kernel mode)
 Multiple Exceptions (managed space)
- Multiple Exceptions (stowed)
 Dynamic Memory Corruption (process heap)
 Dynamic Memory Corruption (kernel pool)
- Dynamic Memory Corruption (managed heap)
 False Positive Dump
 Lateral Damage (general)
- Lateral Damage (CPU mode)
 Optimized Code (function parameter reuse)
 Invalid Pointer (general)
- Invalid Pointer (objects)
 NULL Pointer (code)
 NULL Pointer (data)
 Inconsistent Dump
 Hidden Exception (user space)
- Hidden Exception (kernel space)
- Hidden Exception (managed space)
 Deadlock (critical sections)
 Deadlock (executive resources)
 Deadlock (mixed objects, user space)
 Deadlock (LPC)
 Deadlock (mixed objects, kernel space)
 Deadlock (self)
- Deadlock (managed space)
- Deadlock (.NET Finalizer)
 Changed Environment
 Incorrect Stack Trace
 OMAP Code Optimization
 No Component Symbols
 Insufficient Memory (committed memory)
 Insufficient Memory (handle leak)
 Insufficient Memory (kernel pool)
 Insufficient Memory (PTE)
 Insufficient Memory (module fragmentation)
 Insufficient Memory (physical memory)
 Insufficient Memory (control blocks)
- Insufficient Memory (reserved virtual memory)
- Insufficient Memory (session pool)
- Insufficient Memory (stack trace database)
- Insufficient Memory (region)
- Insufficient Memory (stack)
 Spiking Thread
 Module Variety
 Stack Overflow (kernel mode)
 Stack Overflow (user mode)
 Stack Overflow (software implementation)
- Stack Overflow (insufficient memory)
- Stack Overflow (managed space)
 Managed Code Exception
- Managed Code Exception (Scala)
- Managed Code Exception (Python)
 Truncated Dump
 Waiting Thread Time (kernel dumps)
 Waiting Thread Time (user dumps)
 Memory Leak (process heap) - Modeling Example
 Memory Leak (.NET heap)
- Memory Leak (page tables)
- Memory Leak (I/O completion packets)
- Memory Leak (regions)
 Missing Thread (user space)
- Missing Thread (kernel space)
 Unknown Component
 Double Free (process heap)
 Double Free (kernel pool)
 Coincidental Symbolic Information
 Stack Trace
- Stack Trace (I/O request)
- Stack Trace (file system filters)
- Stack Trace (database)
- Stack Trace (I/O devices)
 Virtualized Process (WOW64)
- Virtualized Process (ARM64EC and CHPE)
 Stack Trace Collection (unmanaged space)
- Stack Trace Collection (managed space)
- Stack Trace Collection (predicate)
- Stack Trace Collection (I/O requests)
- Stack Trace Collection (CPUs)
 Coupled Processes (strong)
 Coupled Processes (weak)
 Coupled Processes (semantics)
 High Contention (executive resources)
 High Contention (critical sections)
 High Contention (processors)
- High Contention (.NET CLR monitors)
- High Contention (.NET heap)
- High Contention (sockets)
 Accidental Lock
 Passive Thread (user space)
 Passive System Thread (kernel space)
 Main Thread
 Busy System
 Historical Information
 Object Distribution Anomaly (IRP)
- Object Distribution Anomaly (.NET heap)
 Local Buffer Overflow (user space)
- Local Buffer Overflow (kernel space)
 Early Crash Dump
 Hooked Functions (user space)
 Hooked Functions (kernel space)
- Hooked Modules
 Custom Exception Handler (user space)
 Custom Exception Handler (kernel space)
 Special Stack Trace
 Manual Dump (kernel)
 Manual Dump (process)
 Wait Chain (general)
 Wait Chain (critical sections)
 Wait Chain (executive resources)
 Wait Chain (thread objects)
 Wait Chain (LPC/ALPC)
 Wait Chain (process objects)
 Wait Chain (RPC)
 Wait Chain (window messaging)
 Wait Chain (named pipes)
- Wait Chain (mutex objects)
- Wait Chain (pushlocks)
- Wait Chain (CLR monitors)
- Wait Chain (RTL_RESOURCE)
- Wait Chain (modules)
- Wait Chain (nonstandard synchronization)
- Wait Chain (C++11, condition variable)
- Wait Chain (SRW lock)
 Corrupt Dump
 Dispatch Level Spin
 No Process Dumps
 No System Dumps
 Suspended Thread
 Special Process
 Frame Pointer Omission
 False Function Parameters
 Message Box
 Self-Dump
 Blocked Thread (software)
 Blocked Thread (hardware)
- Blocked Thread (timeout)
 Zombie Processes
 Wild Pointer
 Wild Code
 Hardware Error
 Handle Limit (GDI, kernel space)
- Handle Limit (GDI, user space)
 Missing Component (general)
 Missing Component (static linking, user mode)
 Execution Residue (unmanaged space, user)
- Execution Residue (unmanaged space, kernel)
- Execution Residue (managed space)
 Optimized VM Layout
- Invalid Handle (general)
- Invalid Handle (managed space)
- Overaged System
- Thread Starvation (realtime priority)
- Thread Starvation (normal priority)
- Duplicated Module
- Not My Version (software)
- Not My Version (hardware)
- Data Contents Locality
- Nested Exceptions (unmanaged code)
- Nested Exceptions (managed code)
- Affine Thread
- Self-Diagnosis (user mode)
- Self-Diagnosis (kernel mode)
- Self-Diagnosis (registry)
- Inline Function Optimization (unmanaged code)
- Inline Function Optimization (managed code)
- Critical Section Corruption
- Lost Opportunity
- Young System
- Last Error Collection
- Hidden Module
- Data Alignment (page boundary)
- C++ Exception
- Divide by Zero (user mode)
- Divide by Zero (kernel mode)
- Swarm of Shared Locks
- Process Factory
- Paged Out Data
- Semantic Split
- Pass Through Function
- JIT Code (.NET)
- JIT Code (Java)
- Ubiquitous Component (user space)
- Ubiquitous Component (kernel space)
- Nested Offender
- Virtualized System
- Effect Component
- Well-Tested Function
- Mixed Exception
- Random Object
- Missing Process
- Platform-Specific Debugger
- Value Deviation (stack trace)
- Value Deviation (structure field)
- Runtime Thread (CLR)
- Runtime Thread (Python, Linux)
- Coincidental Frames
- Fault Context
- Hardware Activity
- Incorrect Symbolic Information
- Message Hooks - Modeling Example
- Coupled Machines
- Abridged Dump
- Exception Stack Trace
- Distributed Spike
- Instrumentation Information
- Template Module
- Invalid Exception Information
- Shared Buffer Overwrite
- Pervasive System
- Problem Exception Handler
- Same Vendor
- Crash Signature
- Blocked Queue (LPC/ALPC)
- Fat Process Dump
- Invalid Parameter (process heap)
- Invalid Parameter (runtime function)
- String Parameter
- Well-Tested Module
- Embedded Comment
- Hooking Level
- Blocking Module
- Dual Stack Trace
- Environment Hint
- Top Module
- Livelock
- Technology-Specific Subtrace (COM interface invocation)
- Technology-Specific Subtrace (dynamic memory)
- Technology-Specific Subtrace (JIT .NET code)
- Technology-Specific Subtrace (COM client call)
- Dialog Box
- Instrumentation Side Effect
- Semantic Structure (PID.TID)
- Directing Module
- Least Common Frame
- Truncated Stack Trace
- Data Correlation (function parameters)
- Data Correlation (CPU times)
- Module Hint
- Version-Specific Extension
- Cloud Environment
- No Data Types
- Managed Stack Trace
- Managed Stack Trace (Scala)
- Managed Stack Trace (Python)
- Coupled Modules
- Thread Age
- Unsynchronized Dumps
- Pleiades
- Quiet Dump
- Blocking File
- Problem Vocabulary
- Activation Context
- Stack Trace Set
- Double IRP Completion
- Caller-n-Callee
- Annotated Disassembly (JIT .NET code)
- Annotated Disassembly (unmanaged code)
- Handled Exception (user space)
- Handled Exception (.NET CLR)
- Handled Exception (kernel space)
- Duplicate Extension
- Special Thread (.NET CLR)
- Hidden Parameter
- FPU Exception
- Module Variable
- System Object
- Value References
- Debugger Bug
- Empty Stack Trace
- Problem Module
- Disconnected Network Adapter
- Network Packet Buildup
- Unrecognizable Symbolic Information
- Translated Exception
- Regular Data
- Late Crash Dump
- Blocked DPC
- Coincidental Error Code
- Punctuated Memory Leak
- No Current Thread
- Value Adding Process
- Activity Resonance
- Stored Exception
- Spike Interval
- Stack Trace Change
- Unloaded Module
- Deviant Module
- Paratext
- Incomplete Session
- Error Reporting Fault
- First Fault Stack Trace
- Frozen Process
- Disk Packet Buildup
- Hidden Process
- Active Thread (Mac OS X)
- Active Thread (Windows)
- Critical Stack Trace
- Handle Leak
- Module Collection
- Module Collection (predicate)
- Deviant Token
- Step Dumps
- Broken Link
- Debugger Omission
- Glued Stack Trace
- Reduced Symbolic Information
- Injected Symbols
- Distributed Wait Chain
- One-Thread Process
- Module Product Process
- Crash Signature Invariant
- Small Value
- Shared Structure
- Thread Cluster
- False Effective Address
- Screwbolt Wait Chain
- Design Value
- Hidden IRP
- Tampered Dump
- Memory Fluctuation (process heap)
- Last Object
- Rough Stack Trace (unmanaged space)
- Rough Stack Trace (managed space)
- Past Stack Trace
- Ghost Thread
- Dry Weight
- Exception Module
- Reference Leak
- Origin Module
- Hidden Call
- Corrupt Structure
- Software Exception
- Crashed Process
- Variable Subtrace
- User Space Evidence
- Internal Stack Trace
- Distributed Exception (managed code)
- Thread Poset
- Stack Trace Surface
- Hidden Stack Trace
- Evental Dumps
- Clone Dump
- Parameter Flow
- Critical Region
- Diachronic Module
- Constant Subtrace
- Not My Thread
- Window Hint
- Place Trace
- Stack Trace Signature
- Relative Memory Leak
- Quotient Stack Trace
- Module Stack Trace
- Foreign Module Frame
- Unified Stack Trace
- Mirror Dump Set
- Memory Fibration
- Aggregated Frames
- Frame Regularity
- Stack Trace Motif
- System Call
- Stack Trace Race
- Hyperdump
- Disassembly Ambiguity
- Exception Reporting Thread
- Active Space
- Subsystem Modules
- Region Profile
- Region Clusters
- Source Stack Trace
- Hidden Stack
- Interrupt Stack
- False Memory
- Frame Trace
- Pointer Cone
- Context Pointer
- Pointer Class
- False Frame
- Procedure Call Chain
- C++ Object
- COM Exception
- Structure Sheaf
- Saved Exception Context (.NET)
- Shared Thread
- Spiking Interrupts
- Structure Field Collection
- Black Box
- Rough Stack Trace Collection (unmanaged space)
- COM Object
- Shared Page
- Exception Collection
- Dereference Nearpoint
- Address Representations
- Near Exception
- Shadow Stack Trace
- Past Process
- Foreign Stack
- Annotated Stack Trace
- Disassembly Summary
- Region Summary
- Analysis Summary
- Region Spectrum
- Normalized Region
- Function Pointer
- Interrupt Stack Collection
- DPC Stack Collection
- Dump Context
- False Local Address
- Encoded Pointer
- Latent Structure
- ISA-Specific Code
Memory Analysis Patterns
Dia|gram Language and Memory Dump Analysis Patterns
We illustrate trace and log analysis patterns using a graphical language named Dia|gram. When we analyze memory dumps, we get textual log output to which we can apply the same analysis patterns. Therefore, we can reuse the same Dia|gram language for memory dump analysis, for example, for analysis pattern illustrations. We start with the first memory dump analysis pattern, Multiple Exceptions. However, we now use some later analysis pattern names in the latter's description, for example, Stack Trace Collection from multiple threads, which consists of Stack Traces from individual threads.
Each individual thread stack trace can be illustrated using this trace diagram with an implicit time arrow but without time values:

If we knew individual stack trace frame timings, we could have assembled the normal trace diagram:
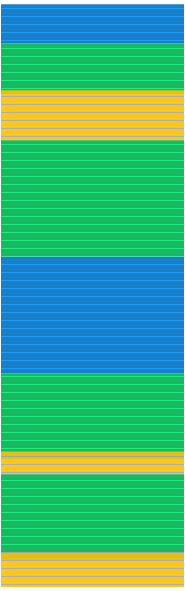
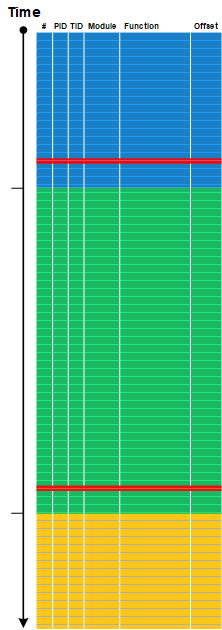
However, we can assemble the combined trace by gluing individual thread traces and sorting them by thread creation time (available in Windows memory dumps):
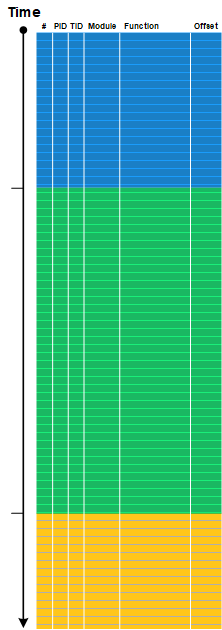
Additionally, we can impose sparse discrete time labels and structure via Trace Schema:
Having ATIDs, we can use the Adjoint Thread of Activity analysis pattern.
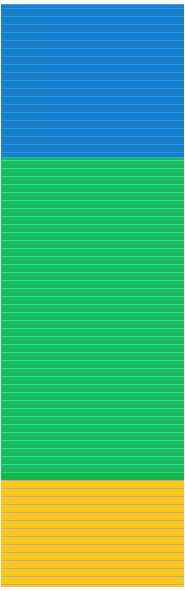
Since we know that top frames existed at the time of the memory snapshot, we can also group them at the end of the trace:
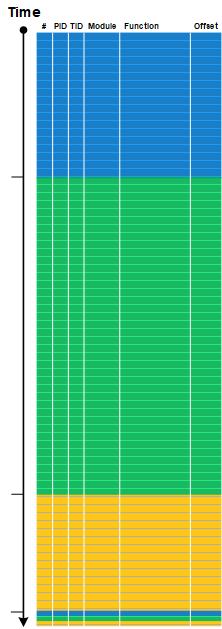
Exception indicators (like exception processing frames) can be highlighted as Error Message and Periodic Error. We can also use Exception Stack Trace:
We can also add other debugger log output to such diagrams for Intra-Correlation.
We now start using Dia|gram in our memory dump analysis training courses and reference materials.
Copyright © 2006 - 2026 Software Diagnostics Institute. Crash Dump Analysis Portal. Trace and Log Analysis Portal. Pattern-Oriented AI, Software Data Analysis, Diagnostics, Observability, Anomaly Detection, Pathology, Forensics, Prognostics, Root Cause Analysis, Debugging, Diagnostics Workflow and Interaction. Software Diagnostics Engineering and Diagnostics-Driven Development. Theoretical Software Diagnostics. Software Narratology, Narratology of Things and Diagnostics of Things (DoT).
Trace and Log Analysis Patterns
- Periodic Error
- Basic Facts
- Circular Trace
- Intra-Correlation
- Statement Density and Current
- Exception Stack Trace
- Thread of Activity
- Discontinuity
- Missing Component
- Bifurcation Point
- Characteristic Message Block
- Activity Region
- Vocabulary Index
- Inter-Correlation
- Significant Event
- Time Delta
- Adjoint Thread of Activity
- Trace Acceleration
- Incomplete History
- Background and Foreground Components
- Defamiliarizing Effect
- Anchor Messages
- No Trace Metafile
- No Activity
- Partition: Head, Prologue, Core, Epilogue, Tail
- Truncated Trace
- Diegetic Messages
- False Positive Error
- Guest Component
- Message Change
- Layered Periodization
- Focus of Tracing
- Event Sequence Order
- Implementation Discourse
- News Value
- Master Trace
- Gossip
- Impossible Trace
- Glued Activity (ATID reuse)
- Message Invariant
- UI Message
- Original Message
- Linked Messages
- Macrofunction
- Marked Message
- Trace Frames
- Break-in Activity
- Resume Activity
- Error Distribution
- Message Context
- Counter Value
- Fiber Bundle
- Periodic Message Block
- Error Message
- Empty Trace
- Data Flow
- Relative Density
- Visibility Limit
- Sparse Trace
- Message Interleave
- Split Trace
- Opposition Messages
- Indexical Trace
- Sheaf of Activities
- Traces of Individuality
- Pivot Message
- Dominant Event Sequence
- Abnormal Value
- Indirect Facts
- State and Event
- Last Activity
- Hidden Error
- Dialogue
- Motif
- Correlated Discontinuity
- Piecewise Activity
- Density Distribution
- Factor Group
- Silent Messages
- Shared Point
- Data Association
- Meta Trace
- State Dump
- Message Cover
- Message Set
- Error Thread
- Activity Divergence
- Hidden Facts
- Back Trace
- Blackout
- Missing Message
- Use Case Trail
- Event Sequence Phase
- Milestones
- File Size
- Singleton Event
- Visitor Trace
- Timeout
- Activity Overlap
- Adjoint Space
- Indirect Message
- Watch Thread
- Punctuated Activity
- Trace Mask
- Trace Viewpoints
- Data Reversal
- Recovered Messages
- Palimpsest Messages
- Message Space
- Interspace
- Translated Message
- Activity Disruption
- Ruptured Trace
- Sequence Repeat Anomaly
- Adjoint Message
- Coupled Activities
- Error Powerset
- Trace Dimension
- Calibrating Trace
- Data Interval
- Identification Messages
- Data Selector
- Declarative Trace
- Trace Extension
- Fourier Activity
- Fiber of Activity
- Missing Data
- Message Pattern
- Activity Theatre
- Small DA+TA
- Surveyor
- Corrupt Message
- Quotient Trace
- Projective Space
- Ornament
- Poincaré Trace
- De Broglie Trace Duality
- Braid Group
- Delay Dynamics
- Activity Quantum
- Trace Presheaf
- Message Directory
- Galois Trace
- Singleton Trace
- Braid of Activity
- Tensor Trace
- Unsynchronized Traces
- Intrinsic ID
- Combed Trace
- Activity Packet
- Ultrasimilar Messages
- Hedges
- Trace Field
- Script Messages
- Working Set
- Trace Homotopy
- Signal
- Renormalization
- Motivic Trace
- Significant Interval
- Random Data
- Truncated Data
- Time Scale
- Trace Sharding
- Phantom Activity
- Critical Point
- Drone Message
- Minimal Trace
- Trace Constants
- Polytrace
- Trace String
- Equivalent Messages
- Cartesian Trace
- Message Annotations
- CoTrace (CoLog, CoData)
- Moduli Trace
- Trace Similarity
- Explanation Trace
- Split Message
- Phase Transition
- Message Flow
- Generative Trace
- Defect Group
- Trace Flux
- Trace Path
- Trace Summary
- Causal History
- Causal Messages
- Causal Chains
- Trace D’Enfant
- Sorted Trace
- Trace Shape
- Trace Contour
- Trace Fabric
- Semantic Field
- Trace Foliation
- Flag
- Strand of Activity
- Cord of Activity
- Text Trace
- Weave of Activity
- Multidimensional Message
- Message Metadata
- Trace Quilt
- Feature of Activity
- Trace Schema
- Definition Trace
- Serial Trace
- Container Trace
- Trace Join
- Message Essence
- Unsynchronized Messages
- Measurement
- Collapsed Message
- Trace Skeleton
- Null Reference
- Trace Braidoids
- Message Complex
- Traceme
- Trace Molecule
- CoActivity
- Trace Window
- Embedded Trace
- Whisker Trace
- Trace Nerve
- Message Bond
- Trace Retract
- Denormalized Message
- Case Messages
- Iconic Traces
- Pattern Vector
- Trace Tessellation
- Canonical Trace
- Trace Benchmark
- Trace Graph
- Trace Amplitude
- Trace Class
- Trace Volume
- Trace Temperature
- Trace Pressure
- Trace Lattice
- Trace Bias
- Trace Variance
- Message Kinetics
- Feynman Trace
- Trace Sketch
- Trace Model
- Message Type
- Implicit Message
- Trace Parameters and Hyperparameters
- Trace Precision and Recall
- Trace Polynomial
- Message Embedding
- Trace Context
- Trace Plan
- Trace Divergence
- Trace Network
- Spatial Form
- Bethe Ansatz
UI Problem Analysis Patterns
Structural Memory Patterns
- Memory Snapshot (Structured or BLOB)
- Aggregate Snapshot
- Snapshot Collection
- Memory Region (Open or Closed)
- Region Boundary
- Memory Hierarchy (General)
- Anchor Region
- Region Strata
Malware Analysis Patterns
- Deviant Module
- Fake Module
- Packed Code
- Pre-Obfuscation Residue
- Module Collection
- No Component Symbols
- Stack Trace Collection
- Hidden Module
- Hidden Process
- Driver Device Collection
- RIP Stack Trace
- Hooksware
- Module Hint
- Unknown Module
- Pass Through Function
- Deviant Token
- Self-Diagnosis
- String Hint
- Execution Residue
- Namespace
- Patched Code
- Raw Pointer
- Out-of-Module Pointer
- Stack Trace Collection (I/O requests)