 Multiple Exceptions (user mode) - Modeling Example
 Multiple Exceptions (kernel mode)
 Multiple Exceptions (managed space)
- Multiple Exceptions (stowed)
 Dynamic Memory Corruption (process heap)
 Dynamic Memory Corruption (kernel pool)
- Dynamic Memory Corruption (managed heap)
 False Positive Dump
 Lateral Damage (general)
- Lateral Damage (CPU mode)
 Optimized Code (function parameter reuse)
 Invalid Pointer (general)
- Invalid Pointer (objects)
 NULL Pointer (code)
 NULL Pointer (data)
 Inconsistent Dump
 Hidden Exception (user space)
- Hidden Exception (kernel space)
- Hidden Exception (managed space)
 Deadlock (critical sections)
 Deadlock (executive resources)
 Deadlock (mixed objects, user space)
 Deadlock (LPC)
 Deadlock (mixed objects, kernel space)
 Deadlock (self)
- Deadlock (managed space)
- Deadlock (.NET Finalizer)
 Changed Environment
 Incorrect Stack Trace
 OMAP Code Optimization
 No Component Symbols
 Insufficient Memory (committed memory)
 Insufficient Memory (handle leak)
 Insufficient Memory (kernel pool)
 Insufficient Memory (PTE)
 Insufficient Memory (module fragmentation)
 Insufficient Memory (physical memory)
 Insufficient Memory (control blocks)
- Insufficient Memory (reserved virtual memory)
- Insufficient Memory (session pool)
- Insufficient Memory (stack trace database)
- Insufficient Memory (region)
- Insufficient Memory (stack)
 Spiking Thread
 Module Variety
 Stack Overflow (kernel mode)
 Stack Overflow (user mode)
 Stack Overflow (software implementation)
- Stack Overflow (insufficient memory)
- Stack Overflow (managed space)
 Managed Code Exception
- Managed Code Exception (Scala)
- Managed Code Exception (Python)
 Truncated Dump
 Waiting Thread Time (kernel dumps)
 Waiting Thread Time (user dumps)
 Memory Leak (process heap) - Modeling Example
 Memory Leak (.NET heap)
- Memory Leak (page tables)
- Memory Leak (I/O completion packets)
- Memory Leak (regions)
 Missing Thread (user space)
- Missing Thread (kernel space)
 Unknown Component
 Double Free (process heap)
 Double Free (kernel pool)
 Coincidental Symbolic Information
 Stack Trace
- Stack Trace (I/O request)
- Stack Trace (file system filters)
- Stack Trace (database)
- Stack Trace (I/O devices)
 Virtualized Process (WOW64)
- Virtualized Process (ARM64EC and CHPE)
 Stack Trace Collection (unmanaged space)
- Stack Trace Collection (managed space)
- Stack Trace Collection (predicate)
- Stack Trace Collection (I/O requests)
- Stack Trace Collection (CPUs)
 Coupled Processes (strong)
 Coupled Processes (weak)
 Coupled Processes (semantics)
 High Contention (executive resources)
 High Contention (critical sections)
 High Contention (processors)
- High Contention (.NET CLR monitors)
- High Contention (.NET heap)
- High Contention (sockets)
 Accidental Lock
 Passive Thread (user space)
 Passive System Thread (kernel space)
 Main Thread
 Busy System
 Historical Information
 Object Distribution Anomaly (IRP)
- Object Distribution Anomaly (.NET heap)
 Local Buffer Overflow (user space)
- Local Buffer Overflow (kernel space)
 Early Crash Dump
 Hooked Functions (user space)
 Hooked Functions (kernel space)
- Hooked Modules
 Custom Exception Handler (user space)
 Custom Exception Handler (kernel space)
 Special Stack Trace
 Manual Dump (kernel)
 Manual Dump (process)
 Wait Chain (general)
 Wait Chain (critical sections)
 Wait Chain (executive resources)
 Wait Chain (thread objects)
 Wait Chain (LPC/ALPC)
 Wait Chain (process objects)
 Wait Chain (RPC)
 Wait Chain (window messaging)
 Wait Chain (named pipes)
- Wait Chain (mutex objects)
- Wait Chain (pushlocks)
- Wait Chain (CLR monitors)
- Wait Chain (RTL_RESOURCE)
- Wait Chain (modules)
- Wait Chain (nonstandard synchronization)
- Wait Chain (C++11, condition variable)
- Wait Chain (SRW lock)
 Corrupt Dump
 Dispatch Level Spin
 No Process Dumps
 No System Dumps
 Suspended Thread
 Special Process
 Frame Pointer Omission
 False Function Parameters
 Message Box
 Self-Dump
 Blocked Thread (software)
 Blocked Thread (hardware)
- Blocked Thread (timeout)
 Zombie Processes
 Wild Pointer
 Wild Code
 Hardware Error
 Handle Limit (GDI, kernel space)
- Handle Limit (GDI, user space)
 Missing Component (general)
 Missing Component (static linking, user mode)
 Execution Residue (unmanaged space, user)
- Execution Residue (unmanaged space, kernel)
- Execution Residue (managed space)
 Optimized VM Layout
- Invalid Handle (general)
- Invalid Handle (managed space)
- Overaged System
- Thread Starvation (realtime priority)
- Thread Starvation (normal priority)
- Duplicated Module
- Not My Version (software)
- Not My Version (hardware)
- Data Contents Locality
- Nested Exceptions (unmanaged code)
- Nested Exceptions (managed code)
- Affine Thread
- Self-Diagnosis (user mode)
- Self-Diagnosis (kernel mode)
- Self-Diagnosis (registry)
- Inline Function Optimization (unmanaged code)
- Inline Function Optimization (managed code)
- Critical Section Corruption
- Lost Opportunity
- Young System
- Last Error Collection
- Hidden Module
- Data Alignment (page boundary)
- C++ Exception
- Divide by Zero (user mode)
- Divide by Zero (kernel mode)
- Swarm of Shared Locks
- Process Factory
- Paged Out Data
- Semantic Split
- Pass Through Function
- JIT Code (.NET)
- JIT Code (Java)
- Ubiquitous Component (user space)
- Ubiquitous Component (kernel space)
- Nested Offender
- Virtualized System
- Effect Component
- Well-Tested Function
- Mixed Exception
- Random Object
- Missing Process
- Platform-Specific Debugger
- Value Deviation (stack trace)
- Value Deviation (structure field)
- Runtime Thread (CLR)
- Runtime Thread (Python, Linux)
- Coincidental Frames
- Fault Context
- Hardware Activity
- Incorrect Symbolic Information
- Message Hooks - Modeling Example
- Coupled Machines
- Abridged Dump
- Exception Stack Trace
- Distributed Spike
- Instrumentation Information
- Template Module
- Invalid Exception Information
- Shared Buffer Overwrite
- Pervasive System
- Problem Exception Handler
- Same Vendor
- Crash Signature
- Blocked Queue (LPC/ALPC)
- Fat Process Dump
- Invalid Parameter (process heap)
- Invalid Parameter (runtime function)
- String Parameter
- Well-Tested Module
- Embedded Comment
- Hooking Level
- Blocking Module
- Dual Stack Trace
- Environment Hint
- Top Module
- Livelock
- Technology-Specific Subtrace (COM interface invocation)
- Technology-Specific Subtrace (dynamic memory)
- Technology-Specific Subtrace (JIT .NET code)
- Technology-Specific Subtrace (COM client call)
- Dialog Box
- Instrumentation Side Effect
- Semantic Structure (PID.TID)
- Directing Module
- Least Common Frame
- Truncated Stack Trace
- Data Correlation (function parameters)
- Data Correlation (CPU times)
- Module Hint
- Version-Specific Extension
- Cloud Environment
- No Data Types
- Managed Stack Trace
- Managed Stack Trace (Scala)
- Managed Stack Trace (Python)
- Coupled Modules
- Thread Age
- Unsynchronized Dumps
- Pleiades
- Quiet Dump
- Blocking File
- Problem Vocabulary
- Activation Context
- Stack Trace Set
- Double IRP Completion
- Caller-n-Callee
- Annotated Disassembly (JIT .NET code)
- Annotated Disassembly (unmanaged code)
- Handled Exception (user space)
- Handled Exception (.NET CLR)
- Handled Exception (kernel space)
- Duplicate Extension
- Special Thread (.NET CLR)
- Hidden Parameter
- FPU Exception
- Module Variable
- System Object
- Value References
- Debugger Bug
- Empty Stack Trace
- Problem Module
- Disconnected Network Adapter
- Network Packet Buildup
- Unrecognizable Symbolic Information
- Translated Exception
- Regular Data
- Late Crash Dump
- Blocked DPC
- Coincidental Error Code
- Punctuated Memory Leak
- No Current Thread
- Value Adding Process
- Activity Resonance
- Stored Exception
- Spike Interval
- Stack Trace Change
- Unloaded Module
- Deviant Module
- Paratext
- Incomplete Session
- Error Reporting Fault
- First Fault Stack Trace
- Frozen Process
- Disk Packet Buildup
- Hidden Process
- Active Thread (Mac OS X)
- Active Thread (Windows)
- Critical Stack Trace
- Handle Leak
- Module Collection
- Module Collection (predicate)
- Deviant Token
- Step Dumps
- Broken Link
- Debugger Omission
- Glued Stack Trace
- Reduced Symbolic Information
- Injected Symbols
- Distributed Wait Chain
- One-Thread Process
- Module Product Process
- Crash Signature Invariant
- Small Value
- Shared Structure
- Thread Cluster
- False Effective Address
- Screwbolt Wait Chain
- Design Value
- Hidden IRP
- Tampered Dump
- Memory Fluctuation (process heap)
- Last Object
- Rough Stack Trace (unmanaged space)
- Rough Stack Trace (managed space)
- Past Stack Trace
- Ghost Thread
- Dry Weight
- Exception Module
- Reference Leak
- Origin Module
- Hidden Call
- Corrupt Structure
- Software Exception
- Crashed Process
- Variable Subtrace
- User Space Evidence
- Internal Stack Trace
- Distributed Exception (managed code)
- Thread Poset
- Stack Trace Surface
- Hidden Stack Trace
- Evental Dumps
- Clone Dump
- Parameter Flow
- Critical Region
- Diachronic Module
- Constant Subtrace
- Not My Thread
- Window Hint
- Place Trace
- Stack Trace Signature
- Relative Memory Leak
- Quotient Stack Trace
- Module Stack Trace
- Foreign Module Frame
- Unified Stack Trace
- Mirror Dump Set
- Memory Fibration
- Aggregated Frames
- Frame Regularity
- Stack Trace Motif
- System Call
- Stack Trace Race
- Hyperdump
- Disassembly Ambiguity
- Exception Reporting Thread
- Active Space
- Subsystem Modules
- Region Profile
- Region Clusters
- Source Stack Trace
- Hidden Stack
- Interrupt Stack
- False Memory
- Frame Trace
- Pointer Cone
- Context Pointer
- Pointer Class
- False Frame
- Procedure Call Chain
- C++ Object
- COM Exception
- Structure Sheaf
- Saved Exception Context (.NET)
- Shared Thread
- Spiking Interrupts
- Structure Field Collection
- Black Box
- Rough Stack Trace Collection (unmanaged space)
- COM Object
- Shared Page
- Exception Collection
- Dereference Nearpoint
- Address Representations
- Near Exception
- Shadow Stack Trace
- Past Process
- Foreign Stack
- Annotated Stack Trace
- Disassembly Summary
- Region Summary
- Analysis Summary
- Region Spectrum
- Normalized Region
- Function Pointer
- Interrupt Stack Collection
- DPC Stack Collection
- Dump Context
- False Local Address
- Encoded Pointer
- Latent Structure
- ISA-Specific Code
Diagnostic Analysis Patterns as MCP Tools for Agentic Diagnostics
Introduction
The Model Context Protocol provides AI systems with a standardized way to connect to external capabilities. In MCP, servers expose capabilities, such as tools, which are callable operations that allow models to interact with external systems and perform computations. The current MCP specification also emphasizes tool safety: some tools may execute commands, run code, access sensitive data, modify state, or trigger powerful side effects; therefore, hosts should provide explicit user consent and human-in-the-loop controls before tool invocation.
In debugging, this naturally suggests a debugger MCP server. Such a server may expose tools for loading memory dumps, executing debugger commands, reading memory, listing threads, showing stacks, resolving symbols, searching logs, extracting trace intervals, and normalizing diagnostic output. These are operational tools. They provide access to artifacts.
Access, however, is not analysis. A dump is not interpreted merely because it has been loaded. A stack is not understood merely because it has been printed. A trace is not analyzed merely because events have been extracted. A log is not explained merely because matching messages have been retrieved.
Diagnostic work requires a semantic layer. It also requires an operational method: what to inspect next, which evidence to collect, which comparison to perform, which extension to invoke, and how to explain the result. This is where Diagnostic Analysis Patterns become MCP tools.
The central claim of this article is:
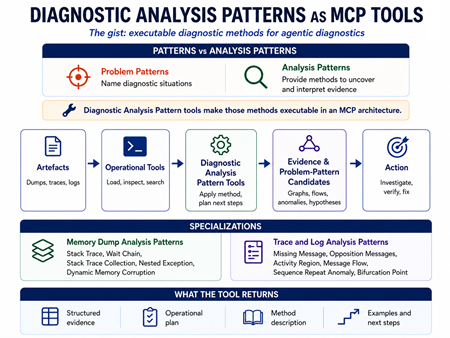
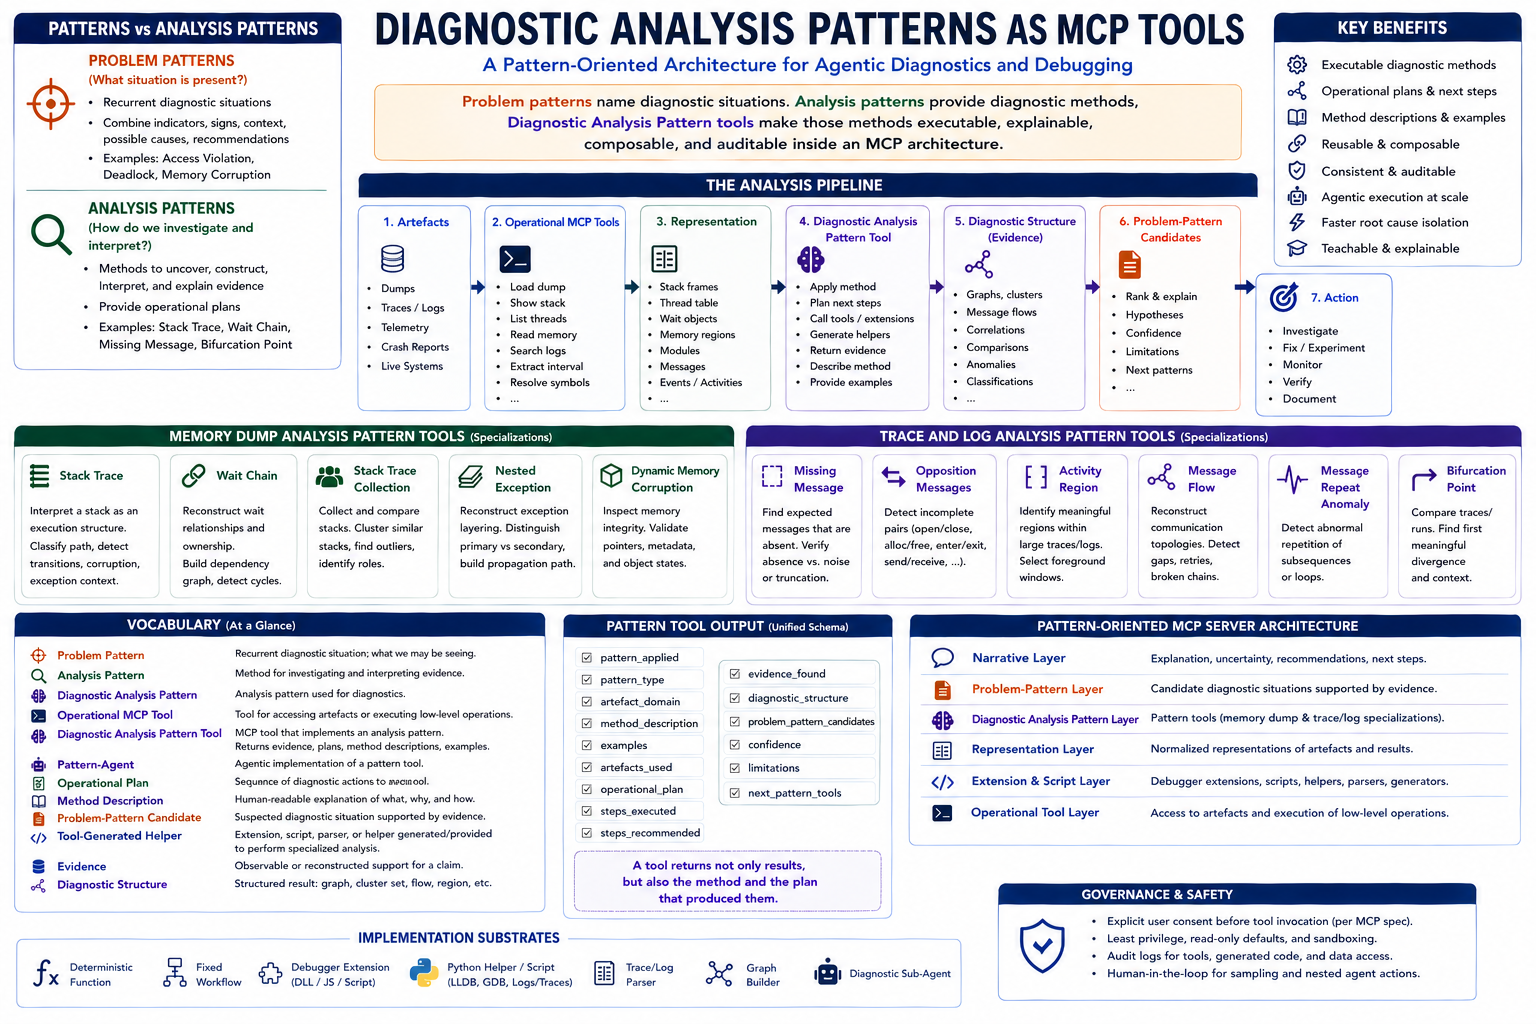
Problem patterns name diagnostic situations. Analysis patterns provide diagnostic methods. Diagnostic Analysis Pattern tools make those methods executable, explainable, composable, and auditable inside an MCP architecture.
The Pattern Square Distinction
The Pattern Square distinction is the theoretical foundation of this proposal. It separates diagnostic patterns into problem patterns and analysis patterns, each of which may be concrete or general. Problem patterns describe recurrent diagnostic situations. Analysis patterns describe techniques for uncovering problem patterns, such as raw stack analysis used to reconstruct a stack trace.
A problem pattern answers the question:
What diagnostic situation is present?
An analysis pattern answers a different question:
How do we uncover, construct, interpret, and explain evidence for that situation?
This distinction is decisive for MCP. The proposed tools are not primarily problem pattern tools. They are analysis pattern tools. They may discover or support problem pattern candidates, but their immediate role is methodological.
For example, a concrete access violation in a specific function within a specific module may be a problem pattern. The methods used to reconstruct the stack, identify the invalid pointer, compare exception context, inspect memory regions, and correlate supporting evidence are analysis patterns. When exposed through MCP, these analysis patterns become callable diagnostic methods.
This article, therefore, uses the term Diagnostic Analysis Pattern to refer to an analysis pattern used for diagnostics. It does not mean a diagnostic problem pattern. It means a diagnostic method.
Vocabulary
A pattern is a recurrent structure. In Pattern-Oriented Diagnostics, this term must be qualified, as different pattern kinds play different roles.
A problem pattern is a recurrent diagnostic situation. It combines indicators, signs, context, possible causes, recommendations, and candidate solutions. It answers: What situation are we seeing?
An analysis pattern is a method for uncovering, constructing, interpreting, or explaining evidence. It does not primarily name the problem itself. It names a way of analyzing artifacts so that problem pattern candidates become visible.
A Diagnostic Analysis Pattern is an analysis pattern used specifically for diagnostics. It provides a method for working with diagnostic artifacts such as memory dumps, stack traces, logs, traces, telemetry streams, crash reports, or test failure outputs.
A Memory Dump Analysis Pattern is a specialization of the Diagnostic Analysis Pattern for memory dumps and debugger-derived representations. Examples include Stack Trace<, Wait Chain, Stack Trace Collection, Nested Exception, and Dynamic Memory Corruption.
A Trace and Log Analysis Pattern is a specialization of the Diagnostic Analysis Pattern for traces, logs, message streams, activity sequences, and event histories. Examples include Missing Message, Opposition Messages, Activity Region, Message Flow, Sequence Repeat Anomaly, and Bifurcation Point.
An Operational MCP Tool provides access to artifacts or executes low-level operations. Examples include load dump, show stack, list threads, read memory, resolve symbols, search logs, and extract trace interval.
A Diagnostic Analysis Pattern Tool is an MCP tool that implements a Diagnostic Analysis Pattern. It may interpret artifacts, generate an operational plan, call lower-level tools, invoke debugger extensions or scripts, generate helper code, return structured evidence, and provide method descriptions with examples.
An Analysis Pattern Agent is an analysis pattern tool with an agentic interior. Externally, it appears as one MCP tool call. Internally, it may plan, call other tools, generate scripts, invoke debugger extensions, evaluate evidence, and recommend follow-up patterns.
An Operational Plan is the sequence of diagnostic actions specified or executed by an analysis pattern.
A Method Description is the human-readable explanation returned by an analysis pattern tool. It explains what should be done, why it should be done, how the pattern works, and how the result should be interpreted.
A Problem Pattern Candidate is a suspected diagnostic situation supported by evidence produced by analysis patterns. It is not necessarily the final diagnosis.
A Tool-Generated Helper is a debugger extension, script, parser, graph builder, trace aligner, or Python-based diagnostic instrument generated or provided by an analysis pattern tool to perform specialized evidence extraction or analysis.
Evidence is the observable, extracted, reconstructed, or inferred support for a diagnostic claim. Evidence may include stack frames, wait relations, exception records, corrupted memory regions, missing messages, unmatched opposition pairs, repeated sequences, message flows, trace divergences, or other structures produced by analysis pattern tools.
A Diagnostic Structure is the organized form that evidence takes after an analysis pattern has been applied. Examples include a stack classification, wait graph, stack cluster set, exception nesting relation, corruption hypothesis, activity region, message flow, sequence repeat anomaly, or bifurcation point. A diagnostic structure is not necessarily the final diagnosis; it is structured evidence that can support candidate problem patterns.
From Operational Tools to Diagnostic Analysis Pattern Tools
A conventional debugger MCP server exposes operational tools. These tools answer access questions:
What threads exist?
What stack frames are present?
Which memory region contains this address?
Which exception record is available?
Which symbols resolve for this module?
Which log messages match this query?
Which trace events occurred in this interval?
A pattern-oriented debugger MCP server exposes a deeper class of tools. These tools answer methodological questions:
How should this stack be interpreted?
How should wait relations be reconstructed?
How should a collection of stacks be compared?
Is there evidence of nested exceptions?
Is dynamic memory corruption worth pursuing?
Which message is missing?
Which opposition pair is incomplete?
Which activity region matters?
Where does the trace bifurcate?
What should be inspected next?
How should the method be explained?
The distinction can be expressed:
Operational tools provide access.
Diagnostic Analysis Pattern tools provide a method.
The pipeline is:
Artefact
  → Operational MCP Tool
  → Representation
  → Diagnostic Analysis Pattern Tool
  → Method Description
  → Operational Plan
  → Evidence Acquisition
  → Diagnostic Structure
  → Problem Pattern Candidate
  → Narrative
  → Action
This pipeline avoids treating the analysis pattern as merely a post-processing label. A Diagnostic Analysis Pattern tool can stand before and after evidence acquisition. It can decide what to collect, compare, normalize, verify, and explain.
MCP Tool as Interface, Analysis Pattern as Semantics
An MCP tool has an external contract that includes the name, description, input schema, and output structure. From the perspective of the main AI agent, the tool is a callable capability. The implementation behind that boundary may be simple or complex: a deterministic function, a fixed workflow, a debugger extension, a script, a rule-based analyzer, a statistical model, or a diagnostic sub-agent.
This gives the following ontology:
MCP Tool              		external callable interface
Analysis Pattern      		diagnostic semantics
Operational Plan      		instantiated sequence of actions
Debugger Extension		execution substrate
Analysis Pattern Agent         	agentic implementation of the tool
Method Description		explainable guidance returned by the tool
For example, a Stack Trace Collection tool may appear externally as:
apply_stack_trace_collection_pattern(dump_id, options)
Internally, it may enumerate threads, collect all stacks, resolve symbols, normalize frames, compute stack signatures, cluster similar stack traces, detect outliers, correlate clusters with thread states, and recommend Wait Chain or Nested Exception analysis.
It may also return a method description:
Collect all thread stacks, normalize frame names, compute stack signatures, group similar stacks, identify repeated execution paths, and inspect outliers. Repeated stack clusters may indicate systemic blocking or normal thread-pool behavior. An isolated anomalous stack may identify the failure thread.
The analysis pattern is not replaced by the tool. The tool makes the analysis pattern executable.
Diagnostic Analysis Pattern Tool Output
A Diagnostic Analysis Pattern tool should not merely return prose. It should return a structured method object. This makes the tool useful for automation, human-guided diagnostics, teaching, review, and audit.
A useful output schema is:
pattern_applied
pattern_type
artifact_domain
method_description
examples
artifacts_used
operational_plan
steps_executed
steps_recommended
evidence_found
diagnostic_structure
problem_pattern_candidates
confidence
limitations
next_pattern_tools
The key point is that the tool returns not only a result but also the diagnostic method that supports it.
A Wait Chain tool should return not only a wait graph but also the plan used to construct it: thread enumeration, wait-state extraction, owner lookup, edge construction, cycle detection, unresolved ownership gaps, and supporting stack evidence.
A Missing Message tool should return not only missing events but also the plan by which expectation was established, and absence was verified: pair definition, activity grouping, window selection, counterpart search, filtering checks, truncation checks, and confidence.
A Bifurcation Point tool should return not only a divergence but also the alignment method: trace pairing, vocabulary normalization, common-prefix construction, divergence localization, surrounding context, and recommended follow-up patterns.
This makes the tool auditable. A human analyst can see what was concluded, what was done operationally, what remains uncertain, and what should be done next.
Memory Dump Analysis Pattern Tools
Memory Dump Analysis Patterns specialize Diagnostic Analysis Patterns for dump artifacts and debugger-derived representations. These representations include stacks, threads, registers, exception records, memory regions, modules, handles, synchronization objects, heap structures, object graphs, and runtime-specific data.
A Stack Trace tool interprets a single stack as an execution structure. Operationally, it retrieves frames, resolves symbols, classifies modules, inspects exception context, detects transitions, and checks for suspicious discontinuities. Its diagnostic structure may be an exception path, a blocking path, a callback chain, a recursive pattern, a corrupted sequence, or a normal worker path.
A Wait Chain tool reconstructs the relationships between waiting entities and their owning entities. Operationally, it identifies waiting threads, inspects wait objects, locates owners, builds a dependency graph, detects cycles, and correlates the graph with stack evidence. Its diagnostic structure is a wait graph with annotations.
A Stack Trace Collection tool compares stack populations. Operationally, it enumerates threads, collects stacks, normalizes frames, computes signatures, clusters similar stacks, identifies outliers, and selects representative stacks for deeper analysis. Its diagnostic structure comprises stack clusters, repeated signatures, anomalous stacks, and role hypotheses.
A Nested Exception tool reconstructs exception layering. Operationally, it enumerates exception records, inspects handler frames, compares primary and secondary exception candidates, and reconstructs propagation paths. Its diagnostic structure is an exception relation rather than a single exception summary.
A Dynamic Memory Corruption tool organizes evidence of corruption. Operationally, it selects suspicious memory regions, inspects allocator metadata, validates pointers, compares object states, searches for overwrite candidates, and recommends verification commands. Its diagnostic structure is a ranked corruption hypothesis supported by memory evidence.
These tools are not problem patterns. They are analysis methods that may support candidate problem patterns.
Trace and Log Analysis Pattern Tools
Trace and Log Analysis Patterns specialize Diagnostic Analysis Patterns for message streams, event histories, activity sequences, temporal regions, communication flows, and comparative traces.
A Missing Message tool detects expected events that are absent. Operationally, it defines expected pairs or protocol sequences, groups messages by activity, chooses temporal windows, searches for counterparts, checks truncation or filtering effects, and reports missing or unmatched elements. Examples include requests without response, open without close, allocate without free, enter without exit, and start without stop.
An Opposition Messages tool organizes messages into semantic pairs such as open and close, create and destroy, allocate and free, enter and exit, load and unload, connect and disconnect, send and receive, call and return. Operationally, it extracts pairs, checks ordering, detects imbalance, identifies incomplete closure, and reports suspicious repetition.
An Activity Region tool delimits the meaningful region inside a larger trace or log. Operationally, it detects boundaries, separates foreground from background, classifies region type, and selects subregions for follow-up patterns.
A Message Flow tool reconstructs communication among threads, components, services, processes, or activity identifiers. Operationally, it extracts participants, constructs edges, detects retries, gaps, loops, broken chains, delayed responses, and abnormal fan-out or fan-in.
A Sequence Repeat Anomaly tool detects repeated subsequences unusual in frequency, placement, duration, or context. Operationally, it windows sequences, mines repeated subsequences, compares frequency against baseline, and distinguishes benign periodicity from abnormal recurrence.
A Bifurcation Point tool compares traces, runs, activity paths, message flows, or execution phases. Operationally, it pairs traces, normalizes vocabulary, aligns common prefixes, locates the first meaningful divergence, and inspects the branch context. The first meaningful branch is often more diagnostically useful than the largest visible difference.
These tools prescribe diagnostic operations and interpret trace and log evidence.
Analysis Pattern Agents and Tool-Generated Helpers
A Diagnostic Analysis Pattern tool can be implemented as a simple function, but many patterns benefit from an agentic interior. From the outside, the main AI agent invokes one MCP tool. Inside, the tool may behave as a diagnostic sub-agent.
MCP sampling is relevant because it allows servers to request LLM completions inside other MCP server features, enabling nested agentic behavior, while recommending human-in-the-loop review for trust, safety, and security .
The resulting hierarchy is:
Main AI Agent
  → MCP Diagnostic Analysis Pattern Tool
  → Analysis Pattern Agent
  → Operational Tools / Scripts / Extensions
  → Artefacts
  → Structured Evidence
Debugger ecosystems already support extension mechanisms. WinDbg supports debugger extension commands exposed by DLLs distinct from debugger binaries, and Microsoft documents how to create custom extension DLL commands. LLDB exposes public APIs through Python bindings, including targets, processes, threads, and frames, and GDB provides a Python API for debugger automation.
This means analysis pattern tools can be implemented through several substrates:
Simple function
Fixed workflow
Debugger extension
Debugger script
Python helper
Trace/log parser
Graph builder
Diagnostic sub-agent
For LLDB and GDB, Python-generated helpers and commands are natural because Python APIs are part of the ecosystem. For WinDbg, generated helper code may target extension DLL scaffolding, JavaScript automation, external Python scripts, or command generation, but a native extension DLL still requires appropriate compilation and integration. For trace and log analysis, generated Python parsers, aligners, graph builders, and report emitters are often more useful than debugger extensions.
The analysis pattern should govern the generated helper. The generated code is not arbitrary automation. It is an operational embodiment of an analysis pattern.
The design with sub-agents can be illustrated in the following diagram: https://www.dumpanalysis.org/files/Tool-Sub-Agent.png
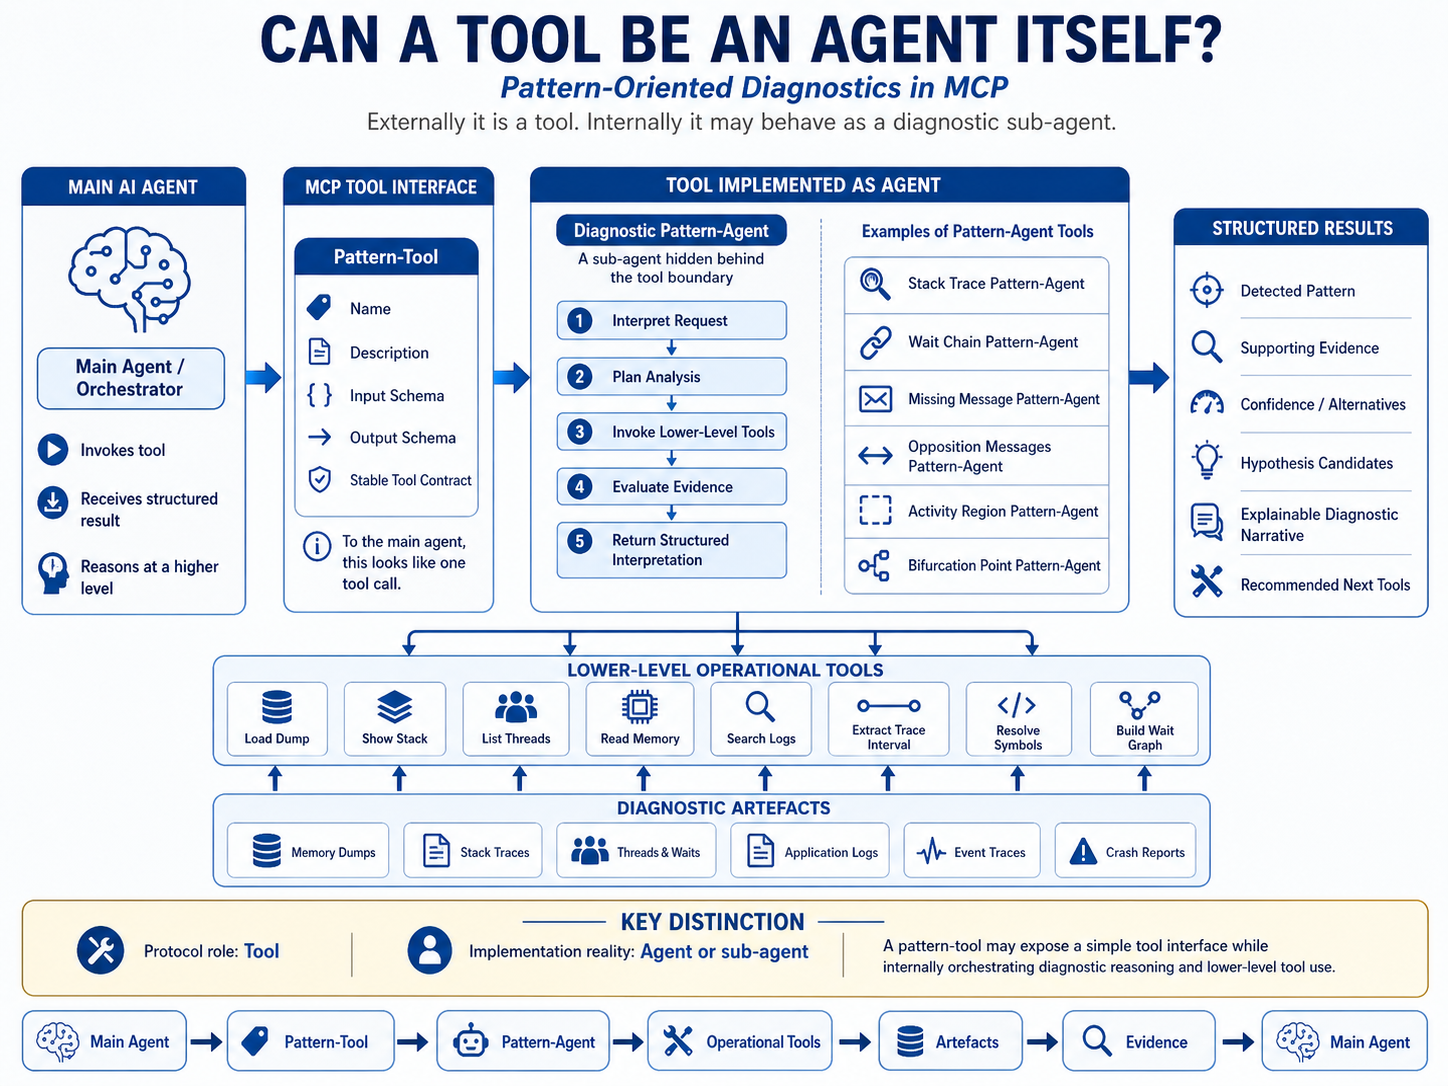
A Concrete MCP Tool Schema Example
A Stack Trace Collection tool could expose the following conceptual schema:
tool_name:
  apply_stack_trace_collection_pattern

input:
  dump_id
  thread_filter
  symbol_policy
  frame_normalization_policy
  clustering_policy
  max_frames
  include_method_description
  include_examples

output:
  pattern_applied
  artifact_domain
  method_description
  examples
  operational_plan
  steps_executed
  stack_clusters
  anomalous_stacks
  representative_threads
  repeated_signatures
  problem_pattern_candidates
  confidence
  limitations
  next_pattern_tools
A typical result might say:
{
  "tool": "apply_stack_trace_collection_pattern",
  "input": {
    "dump_id": "crash_0426",
    "thread_filter": "all",
    "symbol_policy": "resolve_available",
    "include_method_description": true
  },
  "output": {
    "pattern_applied": "Stack Trace Collection",
    "evidence_found": {
      "threads_collected": 42,
      "dominant_stack_cluster": 31,
      "anomalous_stacks": 1
    },
    "problem_pattern_candidates": [
      "Systemic blocking",
      "Exception-bearing worker thread"
    ],
    "next_pattern_tools": [
      "Wait Chain",
      "Stack Trace",
      "Nested Exception"
    ],
  "method_description": "Collect all thread stacks,
normalize frames, compute signatures,
group similar stacks, and inspect outliers.",
  "operational_plan": [
    "enumerate_threads",
    "collect_stacks",
    "normalize_frames",
    "cluster_signatures",
    "identify_outliers"
  ],
  "confidence": "medium"
  }
}
This illustrates the central point: the tool returns method, evidence, plan, examples, candidates, uncertainty, and next steps.
Worked Scenario
Suppose an AI agent is given a crash dump and a corresponding log bundle from a failing service. A command-oriented MCP server can load the dump, list threads, print stacks, and search logs. A pattern-oriented MCP server can do more: it can apply Diagnostic Analysis Pattern tools that return evidence, operational plans, method descriptions, problem pattern candidates, and recommended next tools.
Assume the initial artifacts contain the following simplified observations:
Crash dump:
  Thread 17: exception-bearing stack
  Threads 21-38: shared wait signature
  Threads 3, 7, 12: idle worker stacks
  Several stack suffixes: partially unreliable unwinding

Log activity A42:
  Start → Open → Send → Retry → Retry → Retry
  Missing: Response
  Missing: Close

Successful activity A41:
  Start → Open → Send → Response → Close
The agent first invokes Stack Trace Collection. The tool collects all thread stacks, normalizes frames, computes stack signatures, and clusters similar stacks. It reports that threads 21-38 share a common wait signature, while thread 17 carries an exception-bearing stack. It also reports that several stack suffixes have unreliable unwinding. The tool returns a method description explaining that repeated stack clusters may indicate systemic behavior, while isolated outliers deserve focused inspection.
The agent then invokes Stack Trace on thread 17. This tool classifies the stack as an exception path with suspicious transition frames and recommends applying Nested Exception, since the visible exception may not be the primary failure.
The Nested Exception tool reconstructs exception layering and reports that the visible exception appears secondary. It recommends checking the memory state around objects referenced before the first exception boundary.
The agent invokes Dynamic Memory Corruption. This tool inspects suspicious regions, checks allocator metadata, validates pointers, and returns a ranked corruption hypothesis. At this point, the dump-side analysis suggests a possible relation between the exception-bearing thread and corrupted object state, while the repeated wait signature suggests a broader system impact.
The agent then moves to the log bundle. Activity Region selects the relevant time window around activity A42. It marks the region from Start to the final Retry as diagnostically privileged because the activity begins normally but fails to reach completion.
Message Flow reconstructs communication among components for activity A42 and compares it with the successful activity A41. The successful activity follows:
Start → Open → Send → Response → Close
The failing activity follows:
Start → Open → Send → Retry → Retry → Retry
Missing Message detects the absence of Response and Close in A42. It also checks whether this absence may be due to truncation, filtering, or a logging configuration issue. If those alternatives are not supported, the missing messages become evidence.
Opposition Messages then interprets Open without Close as an incomplete opposition pair. This, by itself, does not prove the cause, but it strengthens the hypothesis that the failing activity did not complete its expected protocol.
Sequence Repeat Anomaly detects the repeated Retry subsequence. It distinguishes ordinary retry behavior from abnormal repetition by checking frequency, context, and absence of the expected Response.
Finally, Bifurcation Point compares A42 with A41 and identifies the first meaningful divergence after Send: the successful path receives a Response, while the failing path enters a loop of Retry. This branch point becomes the diagnostic focus for further investigation.
The final narrative is not a private chain of thought. It is a public diagnostic path:
Stack Trace Collection
  → Stack Trace
  → Nested Exception
  → Dynamic Memory Corruption
  → Activity Region
  → Message Flow
  → Missing Message
  → Opposition Messages
  → Sequence Repeat Anomaly
  → Bifurcation Point
  → Problem Pattern Candidates
The resulting problem pattern candidates may include systemic blocking, exception-bearing worker thread, possible dynamic memory corruption, incomplete request-response protocol, missing completion, and retry-loop behavior. The agent can now recommend next actions: inspect the object referenced before the first exception boundary, verify synchronization ownership for the shared wait cluster, retrieve a wider trace interval around Send, and check whether the component responsible for Response logged an internal failure.
This scenario illustrates the central claim: Diagnostic Analysis Pattern tools do not merely summarize dumps, traces, and logs. They organize diagnostic work. Each tool contributes a method, a plan, evidence, limitations, examples, and recommended continuation.
The Pattern-Oriented Debugger MCP Server
A full pattern-oriented debugger MCP server can be organized into layers:
Operational Layer
  load dump, execute command, read memory, list threads, show stack,
  resolve symbols, search logs, extract trace intervals
Extension and Script Layer
  debugger extensions, scripts, helper modules, generated parsers,
  generated graph builders, generated trace aligners
Representation Layer
  stack frame lists, thread tables, wait graphs, memory regions,
  object graphs, module lists, message streams, activity sequences,
  trace segments, aligned trace pairs
Diagnostic Analysis Pattern Layer
  Stack Trace, Wait Chain, Stack Trace Collection, Nested Exception,
  Dynamic Memory Corruption, Missing Message, Opposition Messages,
  Activity Region, Message Flow, Sequence Repeat Anomaly, Bifurcation Point
Problem Pattern Candidate Layer
  candidate diagnostic situations supported by structured evidence
Narrative Layer
  explanation, uncertainty, recommendations, next steps
This architecture turns the debugger MCP server into more than an interface to commands. It becomes an environment where analysis patterns are executable, semantic, operational, and pedagogical instruments.
Explainability Without Exposing Private Reasoning
Diagnostic Analysis Pattern tools provide a practical alternative to exposing private model reasoning. The agent can report the pattern path, operational plans, method descriptions, evidence, examples, and limitations.
It can say:
Stack Trace Collection organized the stack population.
Stack Trace classified the anomalous stack.
Wait Chain reconstructed synchronization dependency.
Nested Exception distinguished primary from secondary exception evidence.
Dynamic Memory Corruption inspected memory integrity.
The Activity Region delimited the relevant log interval.
Message Flow reconstructed communication.
Missing Message and Opposition Messages detected incomplete protocol behavior.
Sequence Repeat Anomaly detected abnormal repetition.
Bifurcation Point located divergence between normal and abnormal traces.
This is not a hidden reasoning transcript. It is an explicit diagnostic method. It is auditable, repeatable, and teachable.
Governance and Safety
MCP tools are model-controlled capabilities: a model may discover and invoke tools through the host application. The MCP tools specification emphasizes human-in-the-loop control, including clear visibility into available tools, visual indicators when tools are invoked, and confirmation prompts for operations. This is especially important for tools that can access sensitive data, execute commands, generate or run code, modify state, or trigger side effects.
Risk should therefore be assessed per tool, not per protocol: a read-only stack-classification tool, a generated parser, a debugger extension, and a live-system command have different approval requirements.
Analysis pattern tools should declare their data access scope, side effects, generated code, trust level, and operational plan. Generated helpers should default to read-only analysis where possible. Code generation should be sandboxed, logged, reviewed, and explicitly approved before execution. Sampling or nested LLM calls should preserve human-in-the-loop control, especially when the analysis pattern agent asks another model to assist with interpretation or code generation. MCP sampling documentation explicitly recommends a human-in-the-loop with the ability to deny sampling requests.
The principle is simple:
Diagnostic Analysis Pattern tools may be agentic, but they must remain accountable.
Related Work and Boundary of Novelty
The novelty of this proposal is not that AI agents can call tools. That is already central to MCP. It is also not the broad claim that patterns are reusable knowledge. That is fundamental to pattern languages and Pattern-Oriented Diagnostics.
The closest related precedents are MCP tool architectures, existing debugger MCP servers, prompt pattern catalogs for structuring LLM interaction, software analysis patterns in the software engineering tradition, and the Pattern Square distinction between problem patterns and analysis patterns.
The novelty lies in applying the Pattern Square distinction to MCP architecture:
Problem patterns describe diagnostic situations.
Analysis patterns describe diagnostic methods.
Diagnostic Analysis Pattern tools make those methods executable.
The second novelty is the extension of analysis patterns from interpretive methods to method returning operational tools. A Diagnostic Analysis Pattern tool may return structured evidence, an operational plan, a method description, examples, limitations, and recommended next tools.
The third novelty is architectural. Memory Dump Analysis Patterns and Trace and Log Analysis Patterns become specializations of Diagnostic Analysis Patterns inside an MCP server. They are no longer only book entries, analyst vocabulary, or post-hoc explanations. They become callable diagnostic methods.
The fourth novelty is generative. Some analysis pattern tools may synthesize helper scripts, parsers, graph builders, trace aligners, or extension scaffolding. This does not mean unconstrained code generation. It means code generation under the discipline of an analysis pattern.
Conclusion
Diagnostic Analysis Patterns can be exposed as MCP tools. Memory Dump Analysis Patterns and Trace and Log Analysis Patterns are specializations of this broader category. The distinction between problem patterns and analysis patterns is essential: the tools proposed here are not merely names for diagnostic situations, but executable methods for uncovering and structuring evidence.
Some Diagnostic Analysis Pattern tools may be deterministic functions. Some may be workflows. Some may be debugger extensions or scripts. Some may be diagnostic sub-agents. Some may generate helper code. Some may return human-readable guidance and examples explaining how the pattern should be applied.
The final formulation is:
Diagnostic Analysis Patterns are analysis patterns for diagnostics. As MCP tools, they implement diagnostic methods, operational planning, and method descriptions. Memory Dump Analysis Patterns and Trace and Log Analysis Patterns specialize this method for dumps, traces, and logs. Their outputs may identify potential problem patterns, but their primary role is to transform diagnostic artifacts into structured evidence through invocable, auditable, composable, operationally executable, and teachable analysis.
Appendix
The poster download link: https://www.dumpanalysis.org/files/Analysis-Patterns-MCP-Tools.png
PDF: https://www.dumpanalysis.org/files/Diagnostic-Analysis-Patterns-MCP-Tool...