 Multiple Exceptions (user mode) - Modeling Example
 Multiple Exceptions (kernel mode)
 Multiple Exceptions (managed space)
- Multiple Exceptions (stowed)
 Dynamic Memory Corruption (process heap)
 Dynamic Memory Corruption (kernel pool)
- Dynamic Memory Corruption (managed heap)
 False Positive Dump
 Lateral Damage (general)
- Lateral Damage (CPU mode)
 Optimized Code (function parameter reuse)
 Invalid Pointer (general)
- Invalid Pointer (objects)
 NULL Pointer (code)
 NULL Pointer (data)
 Inconsistent Dump
 Hidden Exception (user space)
- Hidden Exception (kernel space)
- Hidden Exception (managed space)
 Deadlock (critical sections)
 Deadlock (executive resources)
 Deadlock (mixed objects, user space)
 Deadlock (LPC)
 Deadlock (mixed objects, kernel space)
 Deadlock (self)
- Deadlock (managed space)
- Deadlock (.NET Finalizer)
 Changed Environment
 Incorrect Stack Trace
 OMAP Code Optimization
 No Component Symbols
 Insufficient Memory (committed memory)
 Insufficient Memory (handle leak)
 Insufficient Memory (kernel pool)
 Insufficient Memory (PTE)
 Insufficient Memory (module fragmentation)
 Insufficient Memory (physical memory)
 Insufficient Memory (control blocks)
- Insufficient Memory (reserved virtual memory)
- Insufficient Memory (session pool)
- Insufficient Memory (stack trace database)
- Insufficient Memory (region)
- Insufficient Memory (stack)
 Spiking Thread
 Module Variety
 Stack Overflow (kernel mode)
 Stack Overflow (user mode)
 Stack Overflow (software implementation)
- Stack Overflow (insufficient memory)
- Stack Overflow (managed space)
 Managed Code Exception
- Managed Code Exception (Scala)
- Managed Code Exception (Python)
 Truncated Dump
 Waiting Thread Time (kernel dumps)
 Waiting Thread Time (user dumps)
 Memory Leak (process heap) - Modeling Example
 Memory Leak (.NET heap)
- Memory Leak (page tables)
- Memory Leak (I/O completion packets)
- Memory Leak (regions)
 Missing Thread (user space)
- Missing Thread (kernel space)
 Unknown Component
 Double Free (process heap)
 Double Free (kernel pool)
 Coincidental Symbolic Information
 Stack Trace
- Stack Trace (I/O request)
- Stack Trace (file system filters)
- Stack Trace (database)
- Stack Trace (I/O devices)
 Virtualized Process (WOW64)
- Virtualized Process (ARM64EC and CHPE)
 Stack Trace Collection (unmanaged space)
- Stack Trace Collection (managed space)
- Stack Trace Collection (predicate)
- Stack Trace Collection (I/O requests)
- Stack Trace Collection (CPUs)
 Coupled Processes (strong)
 Coupled Processes (weak)
 Coupled Processes (semantics)
 High Contention (executive resources)
 High Contention (critical sections)
 High Contention (processors)
- High Contention (.NET CLR monitors)
- High Contention (.NET heap)
- High Contention (sockets)
 Accidental Lock
 Passive Thread (user space)
 Passive System Thread (kernel space)
 Main Thread
 Busy System
 Historical Information
 Object Distribution Anomaly (IRP)
- Object Distribution Anomaly (.NET heap)
 Local Buffer Overflow (user space)
- Local Buffer Overflow (kernel space)
 Early Crash Dump
 Hooked Functions (user space)
 Hooked Functions (kernel space)
- Hooked Modules
 Custom Exception Handler (user space)
 Custom Exception Handler (kernel space)
 Special Stack Trace
 Manual Dump (kernel)
 Manual Dump (process)
 Wait Chain (general)
 Wait Chain (critical sections)
 Wait Chain (executive resources)
 Wait Chain (thread objects)
 Wait Chain (LPC/ALPC)
 Wait Chain (process objects)
 Wait Chain (RPC)
 Wait Chain (window messaging)
 Wait Chain (named pipes)
- Wait Chain (mutex objects)
- Wait Chain (pushlocks)
- Wait Chain (CLR monitors)
- Wait Chain (RTL_RESOURCE)
- Wait Chain (modules)
- Wait Chain (nonstandard synchronization)
- Wait Chain (C++11, condition variable)
- Wait Chain (SRW lock)
 Corrupt Dump
 Dispatch Level Spin
 No Process Dumps
 No System Dumps
 Suspended Thread
 Special Process
 Frame Pointer Omission
 False Function Parameters
 Message Box
 Self-Dump
 Blocked Thread (software)
 Blocked Thread (hardware)
- Blocked Thread (timeout)
 Zombie Processes
 Wild Pointer
 Wild Code
 Hardware Error
 Handle Limit (GDI, kernel space)
- Handle Limit (GDI, user space)
 Missing Component (general)
 Missing Component (static linking, user mode)
 Execution Residue (unmanaged space, user)
- Execution Residue (unmanaged space, kernel)
- Execution Residue (managed space)
 Optimized VM Layout
- Invalid Handle (general)
- Invalid Handle (managed space)
- Overaged System
- Thread Starvation (realtime priority)
- Thread Starvation (normal priority)
- Duplicated Module
- Not My Version (software)
- Not My Version (hardware)
- Data Contents Locality
- Nested Exceptions (unmanaged code)
- Nested Exceptions (managed code)
- Affine Thread
- Self-Diagnosis (user mode)
- Self-Diagnosis (kernel mode)
- Self-Diagnosis (registry)
- Inline Function Optimization (unmanaged code)
- Inline Function Optimization (managed code)
- Critical Section Corruption
- Lost Opportunity
- Young System
- Last Error Collection
- Hidden Module
- Data Alignment (page boundary)
- C++ Exception
- Divide by Zero (user mode)
- Divide by Zero (kernel mode)
- Swarm of Shared Locks
- Process Factory
- Paged Out Data
- Semantic Split
- Pass Through Function
- JIT Code (.NET)
- JIT Code (Java)
- Ubiquitous Component (user space)
- Ubiquitous Component (kernel space)
- Nested Offender
- Virtualized System
- Effect Component
- Well-Tested Function
- Mixed Exception
- Random Object
- Missing Process
- Platform-Specific Debugger
- Value Deviation (stack trace)
- Value Deviation (structure field)
- Runtime Thread (CLR)
- Runtime Thread (Python, Linux)
- Coincidental Frames
- Fault Context
- Hardware Activity
- Incorrect Symbolic Information
- Message Hooks - Modeling Example
- Coupled Machines
- Abridged Dump
- Exception Stack Trace
- Distributed Spike
- Instrumentation Information
- Template Module
- Invalid Exception Information
- Shared Buffer Overwrite
- Pervasive System
- Problem Exception Handler
- Same Vendor
- Crash Signature
- Blocked Queue (LPC/ALPC)
- Fat Process Dump
- Invalid Parameter (process heap)
- Invalid Parameter (runtime function)
- String Parameter
- Well-Tested Module
- Embedded Comment
- Hooking Level
- Blocking Module
- Dual Stack Trace
- Environment Hint
- Top Module
- Livelock
- Technology-Specific Subtrace (COM interface invocation)
- Technology-Specific Subtrace (dynamic memory)
- Technology-Specific Subtrace (JIT .NET code)
- Technology-Specific Subtrace (COM client call)
- Dialog Box
- Instrumentation Side Effect
- Semantic Structure (PID.TID)
- Directing Module
- Least Common Frame
- Truncated Stack Trace
- Data Correlation (function parameters)
- Data Correlation (CPU times)
- Module Hint
- Version-Specific Extension
- Cloud Environment
- No Data Types
- Managed Stack Trace
- Managed Stack Trace (Scala)
- Managed Stack Trace (Python)
- Coupled Modules
- Thread Age
- Unsynchronized Dumps
- Pleiades
- Quiet Dump
- Blocking File
- Problem Vocabulary
- Activation Context
- Stack Trace Set
- Double IRP Completion
- Caller-n-Callee
- Annotated Disassembly (JIT .NET code)
- Annotated Disassembly (unmanaged code)
- Handled Exception (user space)
- Handled Exception (.NET CLR)
- Handled Exception (kernel space)
- Duplicate Extension
- Special Thread (.NET CLR)
- Hidden Parameter
- FPU Exception
- Module Variable
- System Object
- Value References
- Debugger Bug
- Empty Stack Trace
- Problem Module
- Disconnected Network Adapter
- Network Packet Buildup
- Unrecognizable Symbolic Information
- Translated Exception
- Regular Data
- Late Crash Dump
- Blocked DPC
- Coincidental Error Code
- Punctuated Memory Leak
- No Current Thread
- Value Adding Process
- Activity Resonance
- Stored Exception
- Spike Interval
- Stack Trace Change
- Unloaded Module
- Deviant Module
- Paratext
- Incomplete Session
- Error Reporting Fault
- First Fault Stack Trace
- Frozen Process
- Disk Packet Buildup
- Hidden Process
- Active Thread (Mac OS X)
- Active Thread (Windows)
- Critical Stack Trace
- Handle Leak
- Module Collection
- Module Collection (predicate)
- Deviant Token
- Step Dumps
- Broken Link
- Debugger Omission
- Glued Stack Trace
- Reduced Symbolic Information
- Injected Symbols
- Distributed Wait Chain
- One-Thread Process
- Module Product Process
- Crash Signature Invariant
- Small Value
- Shared Structure
- Thread Cluster
- False Effective Address
- Screwbolt Wait Chain
- Design Value
- Hidden IRP
- Tampered Dump
- Memory Fluctuation (process heap)
- Last Object
- Rough Stack Trace (unmanaged space)
- Rough Stack Trace (managed space)
- Past Stack Trace
- Ghost Thread
- Dry Weight
- Exception Module
- Reference Leak
- Origin Module
- Hidden Call
- Corrupt Structure
- Software Exception
- Crashed Process
- Variable Subtrace
- User Space Evidence
- Internal Stack Trace
- Distributed Exception (managed code)
- Thread Poset
- Stack Trace Surface
- Hidden Stack Trace
- Evental Dumps
- Clone Dump
- Parameter Flow
- Critical Region
- Diachronic Module
- Constant Subtrace
- Not My Thread
- Window Hint
- Place Trace
- Stack Trace Signature
- Relative Memory Leak
- Quotient Stack Trace
- Module Stack Trace
- Foreign Module Frame
- Unified Stack Trace
- Mirror Dump Set
- Memory Fibration
- Aggregated Frames
- Frame Regularity
- Stack Trace Motif
- System Call
- Stack Trace Race
- Hyperdump
- Disassembly Ambiguity
- Exception Reporting Thread
- Active Space
- Subsystem Modules
- Region Profile
- Region Clusters
- Source Stack Trace
- Hidden Stack
- Interrupt Stack
- False Memory
- Frame Trace
- Pointer Cone
- Context Pointer
- Pointer Class
- False Frame
- Procedure Call Chain
- C++ Object
- COM Exception
- Structure Sheaf
- Saved Exception Context (.NET)
- Shared Thread
- Spiking Interrupts
- Structure Field Collection
- Black Box
- Rough Stack Trace Collection (unmanaged space)
- COM Object
- Shared Page
- Exception Collection
- Dereference Nearpoint
- Address Representations
- Near Exception
- Shadow Stack Trace
- Past Process
- Foreign Stack
- Annotated Stack Trace
- Disassembly Summary
- Region Summary
- Analysis Summary
- Region Spectrum
- Normalized Region
- Function Pointer
- Interrupt Stack Collection
- DPC Stack Collection
- Dump Context
- False Local Address
- Encoded Pointer
- Latent Structure
- ISA-Specific Code
Debugging and Category Theory
What is debugging? There are many definitions out there, including analogies with forensic science, victimology, and criminology. There are also definitions involving set theory. They focus on the content of debugging artifacts such as source code and its execution paths and values. We give a different definition based on debugging actions and using category theory. We also do not use mathematical notation in what follows.
What is the category theory? We do not give a precise mathematical definition based on axioms but provide a conceptual one as a worldview while omitting many details. A category is a collection of objects and associated arrows between them. Every pair of objects has a collection of arrows between them, which can be empty. So an arrow must have a source and a target object. Several sequential arrows can be composed into one arrow. We can even consider arrows as objects themselves, but this is another category with its new arrows between arrows as objects. If we consider categories as objects and arrows between these categories as objects, we have another category. So we can quickly build complex models out of that.
Can we build a conceptual model of debugging using objects and arrows? Yes, and it even has a particular name in category theory: a presheaf. So, debugging is a presheaf. To answer a question, what is a presheaf, we start constructing our debugging model focusing on objects and arrows. To avoid using mathematical language that may obscure debugging concepts, we use LEGO® bricks because we can feel the objects and arrows, and most importantly, arrows as objects (see visual category theory for more details). This hands-on activity also reminds us that debugging is a construction process.
Debugging activity involves time. We, therefore, construct a time arrow that represents software execution:

We pick two Time objects representing different execution times:

In our Time category, an arrow means the flow of time. It can also be some indexing scheme for time events or other objects (a different category) that represents some repeated activity. Please note that an arrow has specific object indicators assigned to it. Different object pairs have different arrows. It is not apparent when we use black and white mathematical notation and diagrams.

We can associate with Time objects some external objects, for example, memory snapshots, or some other software execution states, variables, execution artifacts, or even parts of the same artifact:

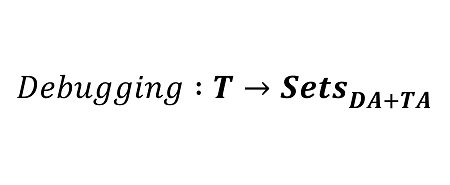
Therefore, we have a possible mapping from the Time category to a possible category of software execution artifacts that we name DA+TA (abbreviated [memory] dump artifacts + trace [log] artifacts). DA+TA objects are simply some sets useful for debugging. The mapping between different categories is usually called a functor in category theory. It maps objects from the source category to objects in the target category. It is itself an arrow in the category that includes source and target categories as objects:

However, we forgot to designate arrows in the target DA+TA category. Of course, a different choice of arrows makes different categories. We choose arrows that represent debugging activities such as going back in time when trying to find the root cause, such as walking a stack trace. It is a reverse activity:

A functor that maps arrows to reversed arrows is called a contravariant functor in category theory:

Such a contravariant functor from a category to the category of some sets is called a presheaf. Now we look at debugging using software traces and logs as another target category of sets. With our Time category objects, we associate different log messages:

When we use log and trace files for debugging we also go back in time trying to find the root cause message (or a set of messages) or some other clues:

Again, we have a presheaf, a contravariant functor that maps our Time category objects to sets of messages:

So, we see again, that debugging is a presheaf, a contravariant functor that maps software execution categories such as a category of time instants to sets of software execution artifacts.
Trace and log analysis pattern catalog includes another example of the source and target categories candidates for a debugging presheaf, Trace Presheaf analysis pattern that maps trace messages to memory snapshots (sets of memory cells or some other state information).
Presheaves can be mapped to each other, for example, from a presheaf of logs to a presheaf of associated source code fragments or stack traces, and this is called a natural transformation in category theory. It also fits with natural debugging when we go back in logs and, at the same time, browse source code or some other associated information sets.
This article is also available in PDF format.