 Multiple Exceptions (user mode) - Modeling Example
 Multiple Exceptions (kernel mode)
 Multiple Exceptions (managed space)
- Multiple Exceptions (stowed)
 Dynamic Memory Corruption (process heap)
 Dynamic Memory Corruption (kernel pool)
- Dynamic Memory Corruption (managed heap)
 False Positive Dump
 Lateral Damage (general)
- Lateral Damage (CPU mode)
 Optimized Code (function parameter reuse)
 Invalid Pointer (general)
- Invalid Pointer (objects)
 NULL Pointer (code)
 NULL Pointer (data)
 Inconsistent Dump
 Hidden Exception (user space)
- Hidden Exception (kernel space)
- Hidden Exception (managed space)
 Deadlock (critical sections)
 Deadlock (executive resources)
 Deadlock (mixed objects, user space)
 Deadlock (LPC)
 Deadlock (mixed objects, kernel space)
 Deadlock (self)
- Deadlock (managed space)
- Deadlock (.NET Finalizer)
 Changed Environment
 Incorrect Stack Trace
 OMAP Code Optimization
 No Component Symbols
 Insufficient Memory (committed memory)
 Insufficient Memory (handle leak)
 Insufficient Memory (kernel pool)
 Insufficient Memory (PTE)
 Insufficient Memory (module fragmentation)
 Insufficient Memory (physical memory)
 Insufficient Memory (control blocks)
- Insufficient Memory (reserved virtual memory)
- Insufficient Memory (session pool)
- Insufficient Memory (stack trace database)
- Insufficient Memory (region)
- Insufficient Memory (stack)
 Spiking Thread
 Module Variety
 Stack Overflow (kernel mode)
 Stack Overflow (user mode)
 Stack Overflow (software implementation)
- Stack Overflow (insufficient memory)
- Stack Overflow (managed space)
 Managed Code Exception
- Managed Code Exception (Scala)
- Managed Code Exception (Python)
 Truncated Dump
 Waiting Thread Time (kernel dumps)
 Waiting Thread Time (user dumps)
 Memory Leak (process heap) - Modeling Example
 Memory Leak (.NET heap)
- Memory Leak (page tables)
- Memory Leak (I/O completion packets)
- Memory Leak (regions)
 Missing Thread (user space)
- Missing Thread (kernel space)
 Unknown Component
 Double Free (process heap)
 Double Free (kernel pool)
 Coincidental Symbolic Information
 Stack Trace
- Stack Trace (I/O request)
- Stack Trace (file system filters)
- Stack Trace (database)
- Stack Trace (I/O devices)
 Virtualized Process (WOW64)
- Virtualized Process (ARM64EC and CHPE)
 Stack Trace Collection (unmanaged space)
- Stack Trace Collection (managed space)
- Stack Trace Collection (predicate)
- Stack Trace Collection (I/O requests)
- Stack Trace Collection (CPUs)
 Coupled Processes (strong)
 Coupled Processes (weak)
 Coupled Processes (semantics)
 High Contention (executive resources)
 High Contention (critical sections)
 High Contention (processors)
- High Contention (.NET CLR monitors)
- High Contention (.NET heap)
- High Contention (sockets)
 Accidental Lock
 Passive Thread (user space)
 Passive System Thread (kernel space)
 Main Thread
 Busy System
 Historical Information
 Object Distribution Anomaly (IRP)
- Object Distribution Anomaly (.NET heap)
 Local Buffer Overflow (user space)
- Local Buffer Overflow (kernel space)
 Early Crash Dump
 Hooked Functions (user space)
 Hooked Functions (kernel space)
- Hooked Modules
 Custom Exception Handler (user space)
 Custom Exception Handler (kernel space)
 Special Stack Trace
 Manual Dump (kernel)
 Manual Dump (process)
 Wait Chain (general)
 Wait Chain (critical sections)
 Wait Chain (executive resources)
 Wait Chain (thread objects)
 Wait Chain (LPC/ALPC)
 Wait Chain (process objects)
 Wait Chain (RPC)
 Wait Chain (window messaging)
 Wait Chain (named pipes)
- Wait Chain (mutex objects)
- Wait Chain (pushlocks)
- Wait Chain (CLR monitors)
- Wait Chain (RTL_RESOURCE)
- Wait Chain (modules)
- Wait Chain (nonstandard synchronization)
- Wait Chain (C++11, condition variable)
- Wait Chain (SRW lock)
 Corrupt Dump
 Dispatch Level Spin
 No Process Dumps
 No System Dumps
 Suspended Thread
 Special Process
 Frame Pointer Omission
 False Function Parameters
 Message Box
 Self-Dump
 Blocked Thread (software)
 Blocked Thread (hardware)
- Blocked Thread (timeout)
 Zombie Processes
 Wild Pointer
 Wild Code
 Hardware Error
 Handle Limit (GDI, kernel space)
- Handle Limit (GDI, user space)
 Missing Component (general)
 Missing Component (static linking, user mode)
 Execution Residue (unmanaged space, user)
- Execution Residue (unmanaged space, kernel)
- Execution Residue (managed space)
 Optimized VM Layout
- Invalid Handle (general)
- Invalid Handle (managed space)
- Overaged System
- Thread Starvation (realtime priority)
- Thread Starvation (normal priority)
- Duplicated Module
- Not My Version (software)
- Not My Version (hardware)
- Data Contents Locality
- Nested Exceptions (unmanaged code)
- Nested Exceptions (managed code)
- Affine Thread
- Self-Diagnosis (user mode)
- Self-Diagnosis (kernel mode)
- Self-Diagnosis (registry)
- Inline Function Optimization (unmanaged code)
- Inline Function Optimization (managed code)
- Critical Section Corruption
- Lost Opportunity
- Young System
- Last Error Collection
- Hidden Module
- Data Alignment (page boundary)
- C++ Exception
- Divide by Zero (user mode)
- Divide by Zero (kernel mode)
- Swarm of Shared Locks
- Process Factory
- Paged Out Data
- Semantic Split
- Pass Through Function
- JIT Code (.NET)
- JIT Code (Java)
- Ubiquitous Component (user space)
- Ubiquitous Component (kernel space)
- Nested Offender
- Virtualized System
- Effect Component
- Well-Tested Function
- Mixed Exception
- Random Object
- Missing Process
- Platform-Specific Debugger
- Value Deviation (stack trace)
- Value Deviation (structure field)
- Runtime Thread (CLR)
- Runtime Thread (Python, Linux)
- Coincidental Frames
- Fault Context
- Hardware Activity
- Incorrect Symbolic Information
- Message Hooks - Modeling Example
- Coupled Machines
- Abridged Dump
- Exception Stack Trace
- Distributed Spike
- Instrumentation Information
- Template Module
- Invalid Exception Information
- Shared Buffer Overwrite
- Pervasive System
- Problem Exception Handler
- Same Vendor
- Crash Signature
- Blocked Queue (LPC/ALPC)
- Fat Process Dump
- Invalid Parameter (process heap)
- Invalid Parameter (runtime function)
- String Parameter
- Well-Tested Module
- Embedded Comment
- Hooking Level
- Blocking Module
- Dual Stack Trace
- Environment Hint
- Top Module
- Livelock
- Technology-Specific Subtrace (COM interface invocation)
- Technology-Specific Subtrace (dynamic memory)
- Technology-Specific Subtrace (JIT .NET code)
- Technology-Specific Subtrace (COM client call)
- Dialog Box
- Instrumentation Side Effect
- Semantic Structure (PID.TID)
- Directing Module
- Least Common Frame
- Truncated Stack Trace
- Data Correlation (function parameters)
- Data Correlation (CPU times)
- Module Hint
- Version-Specific Extension
- Cloud Environment
- No Data Types
- Managed Stack Trace
- Managed Stack Trace (Scala)
- Managed Stack Trace (Python)
- Coupled Modules
- Thread Age
- Unsynchronized Dumps
- Pleiades
- Quiet Dump
- Blocking File
- Problem Vocabulary
- Activation Context
- Stack Trace Set
- Double IRP Completion
- Caller-n-Callee
- Annotated Disassembly (JIT .NET code)
- Annotated Disassembly (unmanaged code)
- Handled Exception (user space)
- Handled Exception (.NET CLR)
- Handled Exception (kernel space)
- Duplicate Extension
- Special Thread (.NET CLR)
- Hidden Parameter
- FPU Exception
- Module Variable
- System Object
- Value References
- Debugger Bug
- Empty Stack Trace
- Problem Module
- Disconnected Network Adapter
- Network Packet Buildup
- Unrecognizable Symbolic Information
- Translated Exception
- Regular Data
- Late Crash Dump
- Blocked DPC
- Coincidental Error Code
- Punctuated Memory Leak
- No Current Thread
- Value Adding Process
- Activity Resonance
- Stored Exception
- Spike Interval
- Stack Trace Change
- Unloaded Module
- Deviant Module
- Paratext
- Incomplete Session
- Error Reporting Fault
- First Fault Stack Trace
- Frozen Process
- Disk Packet Buildup
- Hidden Process
- Active Thread (Mac OS X)
- Active Thread (Windows)
- Critical Stack Trace
- Handle Leak
- Module Collection
- Module Collection (predicate)
- Deviant Token
- Step Dumps
- Broken Link
- Debugger Omission
- Glued Stack Trace
- Reduced Symbolic Information
- Injected Symbols
- Distributed Wait Chain
- One-Thread Process
- Module Product Process
- Crash Signature Invariant
- Small Value
- Shared Structure
- Thread Cluster
- False Effective Address
- Screwbolt Wait Chain
- Design Value
- Hidden IRP
- Tampered Dump
- Memory Fluctuation (process heap)
- Last Object
- Rough Stack Trace (unmanaged space)
- Rough Stack Trace (managed space)
- Past Stack Trace
- Ghost Thread
- Dry Weight
- Exception Module
- Reference Leak
- Origin Module
- Hidden Call
- Corrupt Structure
- Software Exception
- Crashed Process
- Variable Subtrace
- User Space Evidence
- Internal Stack Trace
- Distributed Exception (managed code)
- Thread Poset
- Stack Trace Surface
- Hidden Stack Trace
- Evental Dumps
- Clone Dump
- Parameter Flow
- Critical Region
- Diachronic Module
- Constant Subtrace
- Not My Thread
- Window Hint
- Place Trace
- Stack Trace Signature
- Relative Memory Leak
- Quotient Stack Trace
- Module Stack Trace
- Foreign Module Frame
- Unified Stack Trace
- Mirror Dump Set
- Memory Fibration
- Aggregated Frames
- Frame Regularity
- Stack Trace Motif
- System Call
- Stack Trace Race
- Hyperdump
- Disassembly Ambiguity
- Exception Reporting Thread
- Active Space
- Subsystem Modules
- Region Profile
- Region Clusters
- Source Stack Trace
- Hidden Stack
- Interrupt Stack
- False Memory
- Frame Trace
- Pointer Cone
- Context Pointer
- Pointer Class
- False Frame
- Procedure Call Chain
- C++ Object
- COM Exception
- Structure Sheaf
- Saved Exception Context (.NET)
- Shared Thread
- Spiking Interrupts
- Structure Field Collection
- Black Box
- Rough Stack Trace Collection (unmanaged space)
- COM Object
- Shared Page
- Exception Collection
- Dereference Nearpoint
- Address Representations
- Near Exception
- Shadow Stack Trace
- Past Process
- Foreign Stack
- Annotated Stack Trace
- Disassembly Summary
- Region Summary
- Analysis Summary
- Region Spectrum
- Normalized Region
- Function Pointer
- Interrupt Stack Collection
- DPC Stack Collection
- Dump Context
- False Local Address
- Encoded Pointer
- Latent Structure
- ISA-Specific Code
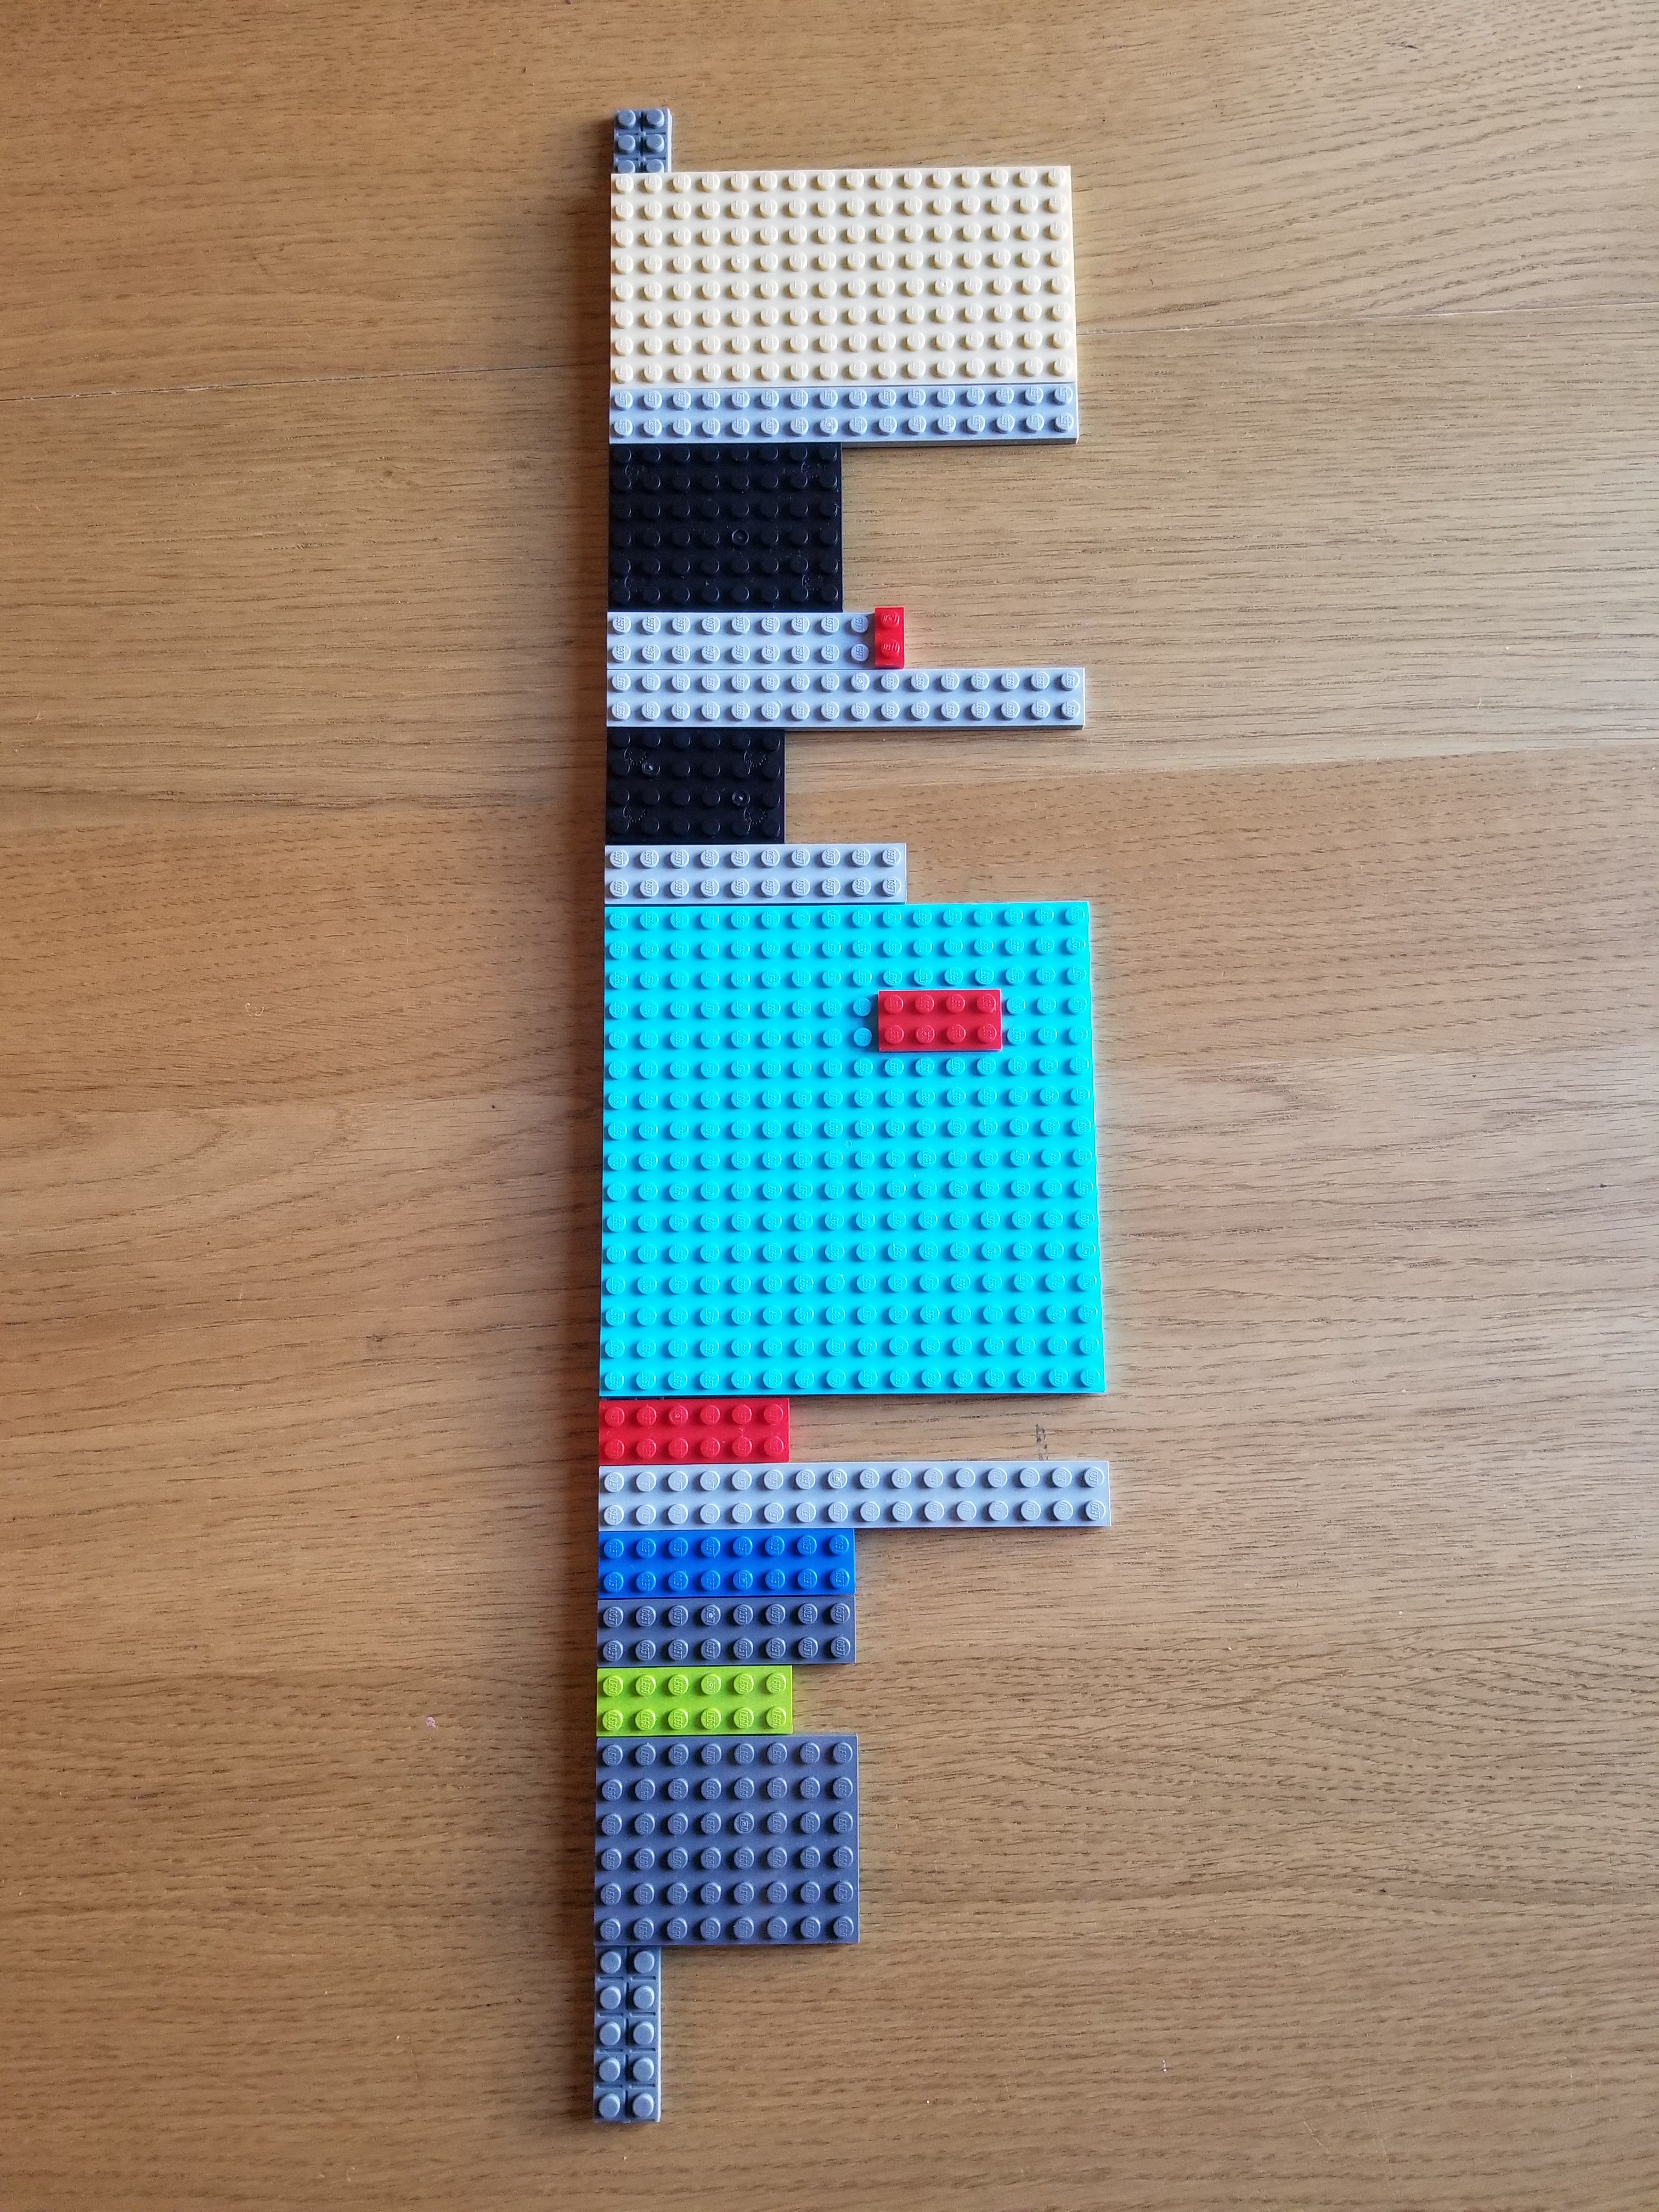
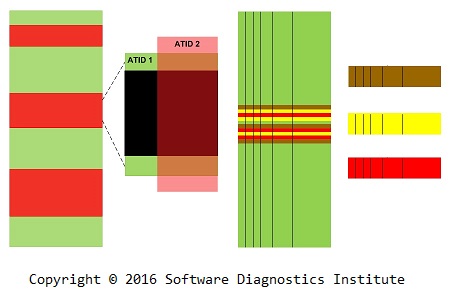
Lego Log Analysis
In addition to Dia|gram graphical diagnostic analysis language, we use to illustrate trace and log analysis patterns we introduce a Lego-block approach. A typical software log is illustrated in this picture with Lego blocks of different colors corresponding to different trace message types, Motifs, activities, components, processes or threads depending on an analysis pattern:

For a starter, we illustrate 3 very common error message patterns (red blocks). The illustration of Error Message shows different types of error data visualizations:
The two illustrations of Periodic Error pattern show typical Error Distribution patterns:


We plan to add more such illustrations in the future to this online article and also include them in the forthcoming Memory Dump Analysis Anthology volumes (starting from volume 11).
Meso-problem Solving using Meso-patterns
Meso-problems are software design and development problems that require short hard-limited time to solve satisfactorily with good quality. The time limit is usually not more than an hour. The prefix meso- means intermediate. These meso-problems are distinct from normal software design problems (macro-problems) which require much more time to solve and implementation idioms (micro-problems) that are usually implementation language-specific. In contrast to macro-problems where final solutions are accompanied by software documentation and micro-problems solved without any documentation except brief source code comments, meso-problem solutions include a specific narrative outlining the solution process with elements of theatrical performance. In a satisfactory meso-problem solution such a narrative dominates actual technical solution, for example, code.
Meso-problems are solved with the help of Meso-patterns: general solutions with accompanying narrative applied in specific contexts to common recurrent meso-problems. Since problem-solving time is limited the solutions may not be optimal, extendable, and maintainable as real-world solutions for similar (macro-)problems. The accompanying narrative should mention such differences.
We should not confuse meso-patterns with elemental design patterns*, elementary building blocks of conventional design patterns. Such patterns and their building blocks can be a part of meso-patterns’ solutions and narratives.
Typically, meso-problem solving occurs during technical interviews. However, it can also be a part of code and design reviews, mentoring and coaching.
Whereas general patterns and specific idioms address the questions of What and How, meso-patterns also address the Why question.
Because the Why narrative is an integral part of Meso-patterns they can be applied to homework interview programming problems as well (even when they are not Meso-problems). In such a case it is recommended to embed Why narratives in source code comments. Such narratives are not necessary for programming contests and online coding sessions when solutions are checked automatically. However, it is advised to duplicate essential narrative parts in code comments in case the code is forwarded to other team members for their assessment, even if an interviewer is present during the online coding session.
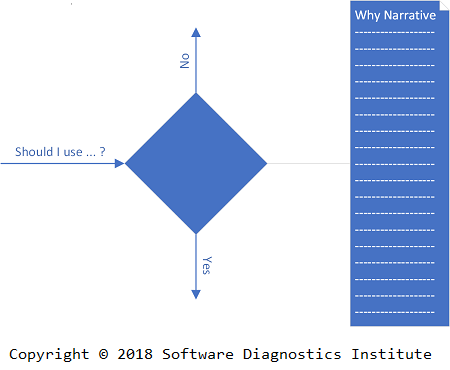
The first general Meso-pattern we propose is called Dilemma (see dilemma definition). Dilemma problems arise at almost every point of a technical interview and need to be solved. They also happen in software design and development, but their solutions are not usually accompanied by explicitly articulated narratives outlining various alternatives and their pro and contra arguments (except in good books teaching computer science and software engineering problem solving). Time constraints are not overly fixed and can be adjusted if necessary. The documentation contains only final decisions. In contrast, during technical interviews when we have dilemmas we need to articulate them aloud, outline alternative solutions considering various hints from interviewers while asking questions during the problem-solving process. The dilemma problem-solving narrative is as much important as the written diagram, code or pseudo-code, and can compensate for the incomplete solution code if it is obvious from the narrative that an interviewee would have finished writing solution code if given more time.
Dilemma meso-problems also happen during design and code review discussions as stakeholders must defend their decisions.
It is important to narrate every Dilemma as the failure to do so may result in a wrong perception, downgraded and even rejected solution. For example, even the simple act of choosing a particular naming convention needs to be articulated, making an interviewer aware of interviewee’s knowledge of coding standards and experience with programming styles dominant on various platforms.
We are building a catalogue of Meso-patterns and publish them one by one in subsequent articles with examples.
* Jason McC. Smith, Elemental Design Patterns (ISBN: 978-0321711922)
Dump2Picture 2
11 years ago, we introduced static natural memory visualization technique according to our memory visualization tool classification. The program we wrote appended BMP file header at the beginning of a DMP file (the source code was published in Memory Dump Analysis Anthology, Volume 2). However, it had the limitation of 4GB BMP image file format which we followed strictly. Because of that, we switched to other image processing tools that allow interpretation of memory as a RAW picture (see Large-scale Structure of Memory Space). Recently, some readers of Memory Dump Analysis Anthology, researchers, and memory visualization enthusiasts asked me for the updated version that can handle memory dumps bigger than 4GB. To allow bigger files, we used the workaround (which we plan to add to our Workaround Patterns catalog) by ignoring the file size structure fields for file sizes higher than 4GB. Some image file viewers ignore these fields (we used IrfanView 64-bit for testing). We took the opportunity to use the latest C++17 standard while refactoring the Windows legacy source code.
The full source code and Visual Studio 17 solution with built Release x64 executable can be found here: https://bitbucket.org/softwarediagnostics/dump2picture
Below are some images we produced.
The picture of the memory dump used in Hyperdump memory analysis pattern:

The picture of the complete 16GB memory dump saved after system start:

The picture of the complete 16GB memory dump saved after a few days of system work:
Integral Diamathics – Tracing the Road to Root Cause
Recently we noticed a published book about biology and mathematics (with some emphasis on category theory) called “Integral Biomathics: Tracing the Road to Reality” (ISBN: 978-3642429606). We liked that naming idea because we are interested in applying category theory to software diagnostics (and diagnostics in general). Our road started more than a decade ago after reading “Life Itself: A Comprehensive Inquiry Into the Nature, Origin, and Fabrication of Life” by Robert Rosen (ISBN: 978-0231075657) recommended in “Categories for Software Engineering” by Jose Luiz Fiadeiro (ISBN: 978-3540373469). We also read “Memory Evolutive Systems: Hierarchy, Emergence, Cognition” book (ISBN: 978-0444522443) written by one of the editors and contributors to “Integral Biomathics” (Andrée C. Ehresmann) and the semi-popular overview of contemporary physics “The Road to Reality” (ISBN: 978-0679454434) by Roger Penrose. Certainly, the editors of “Integral Biomathics” wanted to combine biology, mathematics, and physics into one integral whole. Something we also wanted to do for memory analysis and forensics intelligence (unpublished “Memory Analysis Forensics and Intelligence: An Integral Approach” ISBN: 978-1906717056) planned before we started our work on software trace analysis patterns and software narratology. Our subsequent research borrowed a lot of terminology and concepts from contemporary mathematics.
As a result, we recognized the need to name diagnostic mathematics as Diamathics, and its Integral Diamathics version subtitled as “The Road to Root Cause” since we believe that diagnostics is an integral part of root cause analysis as analysis of analysis. To mark the birth of Diamathics we created a logo for it:

In its design, we used the sign of an indefinite integral and diagnostic components from Software Diagnostics Institute logo (also featured on “Theoretical Software Diagnostics” book front cover). The orientation of UML components points to past (forensics) and future (prognostics) and reflects our motto: Pattern-Oriented Software Diagnostics, Forensics, Prognostics (with subsequent Root Cause Analysis and Debugging).
Diagnostics-Driven Development (Part 1)
Bugs are inevitable in software during its construction. Even, if good coding practices such as test-driven development, checklists for writing effective code, and using well-tested standards-based libraries instead of crafting your own eliminate non-functional defects such as resource leaks and crashes, functional defects are there to stay. On the other hand, if test cases show that functional requirements are met, some non-functional defects such as leaks may evade detection and manifest themselves during later phases of development. Therefore, it is vital to start diagnosing all kinds of software defects as earlier as possible. Here, pattern-oriented software diagnostics may help by providing problem patterns (what to look for), and analysis patterns (how to look for) for different types of software execution artifacts such as memory dumps and software logs. The following two best practices we found useful during the development of various software over the last 15 years:
- Periodic memory dump analysis of processes. Such analysis can be done offline after a process finished its execution or just-in-time by attaching a debugger to it.
- Adding trace statements as earlier as possible for checking various conditions, the correct order of execution, and the state. Such Declarative Trace allows earlier application of pattern-oriented trace and log analysis. Typical analysis patterns at this stage of software construction include Significant Events, Event Sequence Order, Data Flow, State Dump, and Counter Value.
We plan to explain this proposed software development process further and provide practical examples (with source code) in the next parts.
Narrachain
Narrachain is an application of blockchain technology to software narratives, stories of computation, such as traces and logs including generalized traces such as memory dumps. Based on Software Narratology Square it also covers software construction narratives and, more generally, graphs (trees) of software narratives.
In case of software traces and logs, a blockchain-based software narrative may be implemented by adding an additional distributed trace that records the hash of a message block together with the hash of a previous block (a hash chain). This is depicted in the following diagram where Palimpsest Message appeared after the software narrative was growing for some time:
Performance considerations may affect the size of message blocks.
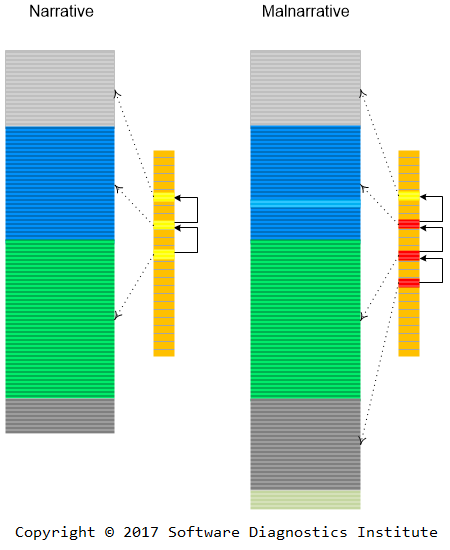
Narrachains can be used to prevent malnarratives and prove the integrity of software execution artifacts. The novel approach here is an integration of such a technology into a system of diagnostic analysis patterns (for example, problem description analysis patterns, trace and log analysis patterns, memory analysis patterns, unified debugging patterns). Narrascope, a narrative debugger, developed by Software Diagnostics Services, will include the support for NarraChain trace and log analysis pattern as well.
Narrachains can also be used for maintaining integrity of software support workflows by tracking problem information and its changes. For example, changes in problem description or newly found diagnostic indicators trigger invalidation of diagnostic analysis reports and re-evaluation of troubleshooting suggestions.
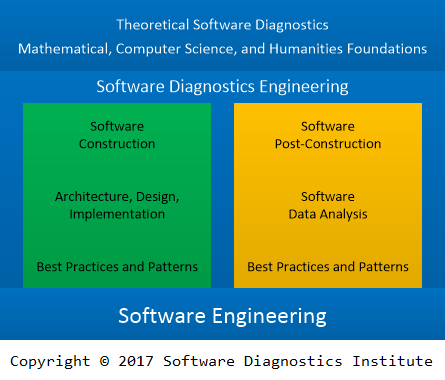
Software Diagnostics Engineering
When analyzing best practices for cloud architectures and corresponding software design and implementation, we realized that telemetry and logging patterns were completely detached from their analysis activities which were not even mentioned when expected. Some unification is needed there for software construction and software post-construction phases related to software diagnostics solutions. We propose to name the unified discipline Software Diagnostics Engineering which has a solid foundation in Theoretical Software Diagnostics we introduced earlier. This discipline is not limited to the cloud and site engineering but encompasses software technologies vertically (full stack software diagnostics) as well as horizontally (IoT devices, mobile and desktop applications, individual servers, clusters, clouds, and fogs). The difference between other diagnostic engineering disciplines is that in software diagnostics we know software internals and can perform operations not possible in technical and medical diagnostics. We use the definition of software diagnostics introduced in the latest seminar as a discipline studying signs of software structure and behavior in software execution artifacts (such as memory dumps, software and network traces and logs) using systemic and pattern-oriented analysis methodologies.
Software diagnostics engineering includes specialized patterns for software diagnostics architecture in addition to software engineering best practices and patterns used to construct software diagnostics components and systems. But it also includes software post-construction best practices and patterns, for example, software data analysis patterns for software execution artifacts such as memory dumps and machine generated logs, as well as security related analysis of network traces, logs and memory. We depict software diagnostics engineering and its theoretical and engineering foundations in the following diagram:
Diagnostic Operads
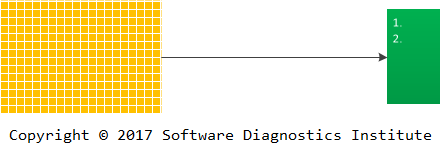
When introducing software data codiagnostics we mentioned artifact transformations through data analysis patterns. Such analysis patterns were devised for human-assisted data diagnostics (for example, software log analysis) and may be too coarse and high-level for formalization and software implementation. Some of them may be split into more elementary transformations which are composable in an associative way. Some may have multiple artifact inputs and additional parameters. All these suggested a name for such transformations based on the analogy with operads in mathematics: a diagnostic operad. However, this name is a different portmanteau of "operations" and "diagnostics". "Historically, the theoretical study of compositions of operations appeared in the 1950s in the work of Michel Lazard as analyseurs"*.
The preliminary definition for our purposes is:
A diagnostic operad is a sequence of diagnostic operations required to extract diagnostic indicators in a diagnostic process described by diagnostic analysis patterns.
Such a sequence may involve operations from different analysis patterns. This is illustrated in the following diagram:
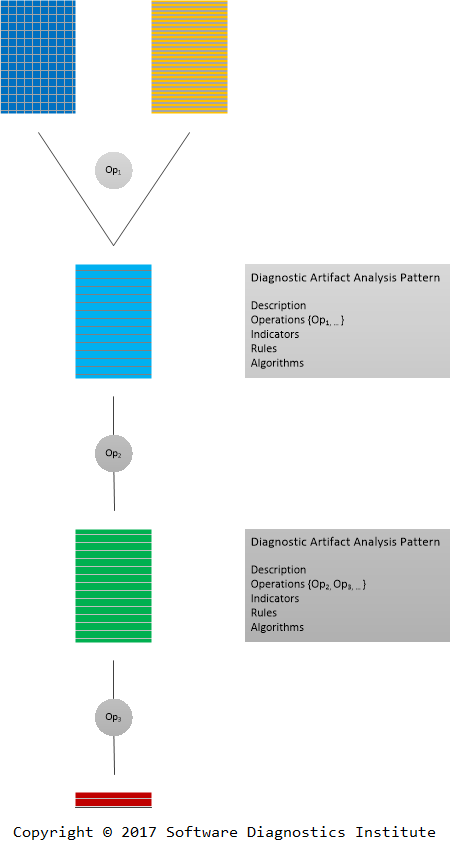
The operadic approach resembles Elementary Analysis Patterns introduced earlier for memory artifact analysis, but the latter include operations which do not transform or query artifacts. Perhaps diagnostic operads should include some of such operations formalized in a way to make them applicable to other types of artifacts such as logs.
* Jean-Louis Loday, Bruno Vallette, Algebraic Operads, page vii (ISBN: 978-3642448355)
Resume and CV as Memory Analysis Artifacts and General Traces
Ultimately, writing Resume and CV is a memory analysis activity with similar memory analysis patterns used. The composed artifacts can be considered as general traces and are analyzed by recruiters and prospective employers for structural and behavioral signs (not necessarily abnormal). This is similar to using trace and log analysis patterns to find positive software behavior characteristics, for example, in performance analysis. Writing resumes and curricula vitae as well as their analysis can be further analyzed.
Since many memory analysis patterns are tool independent we provide two resume examples:
The Most Important Skill in Software Diagnostics
Browsing through the pile of the “old” unread Communications of the ACM magazines we found an article “A Closer Look at Attention to Detail” about “another non-technical skill fundamental to success in IT beyond communications, interpersonal, and leadership skills” (Communications of the ACM July 2005/Vol. 48. No. 7, pp. 87 – 92).
The reason why it caught our attention was that we already thought about it in the context of software diagnostics, initially as various common mistakes, anti-patterns, and style. Some of these can be considered as attention to detail patterns (ATDP), and we are working on the attention to detail pattern catalog.
Although according to the article, some view this skill as a personal quality and some as a skill that can be improved, we view it as a general skill everyone has but with varying domain dependent levels. It can be taught if its level is very low and improved if already present. Individuals have degrees of this skill depending on a domain of activity: for example, a person may be good at business or people management attention to detail but somewhat lack that skill when it comes to technical matters and vice versa. So domain specific facets of that skill may be improved over time through training and self-education and reinforced via auditing feedback. This is especially true in software support environments that require a different skill set than software engineering.
Analysis pattern orientation facilitates this attention to detail through various pattern catalogs and checklists from software execution artifact collection to writing diagnostic analysis reports including analysis audits.
The ACM article also lists various definitions and views of attention to detail from quality, accuracy, correctness, “not overlooking anything” and conscientiousness to “a firm grasp of what’s going on”. Here, for the latter, pattern orientation applied to software internals may help too.
Regarding the importance of attention to detail (ATD), we would like to quote the referenced ACM article: “ATD is most important in the analyst role where ‘the details’ are analyzed and evaluated. The challenge is frequently putting details in context and knowing what needs to be analyzed and when enough analysis has been completed”.
We also think that organizations that don’t emphasize this skill are not good at attention to detail.
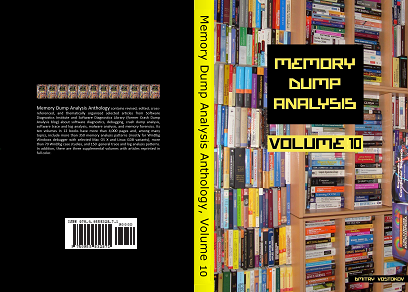
Memory Dump Analysis Anthology, Volume 10
The following direct links can be used to order the book now:
Buy Paperback or Kindle from Amazon
Buy Paperback from Barnes & Noble
Buy Paperback from Book Depository
Also available in PDF format from Software Diagnostics Services
This reference volume consists of revised, edited, cross-referenced, and thematically organized selected articles from Software Diagnostics Institute (DumpAnalysis.org + TraceAnalysis.org) and Software Diagnostics Library (former Crash Dump Analysis blog, DumpAnalysis.org/blog) about software diagnostics, root cause analysis, debugging, crash and hang dump analysis, software trace and log analysis written in October 2016 - May 2017 for software engineers developing and maintaining products on Windows platforms, quality assurance engineers testing software, technical support and escalation engineers dealing with complex software issues, security researchers, reverse engineers, malware and memory forensics analysts. This volume is fully cross-referenced with volumes 1 – 9 and features:
- 15 new crash dump analysis patterns
- New Linux core dump analysis pattern
- 18 new software trace and log analysis patterns
- Introduction to topological software trace and log analysis
- Introduction to software diagnostic spaces as general graphs of software narratives
- Software diagnostics as archaeology
- Introduction to pattern-oriented diagnostic analysis process
- Principles of pattern-oriented software data analysis
- Abstract debugging commands (ADC) initiative
- Introduction to elementary analysis patterns and reduction of analysis pattern complexity
- Introduction to categorical foundations of software diagnostics
- Introduction to existential prognostics and periodic table of diagnostic patterns
- Introduction to software codiagnostics
- Volume index of memory dump analysis patterns
- Volume index of trace and log analysis patterns
Product information:
- Title: Memory Dump Analysis Anthology, Volume 10
- Authors: Dmitry Vostokov, Software Diagnostics Institute
- Language: English
- Product Dimensions: 22.86 x 15.24
- Paperback: 168 pages
- Publisher: OpenTask (May 2017)
- ISBN-13: 978-1-908043-85-6
Software Codiagnostics
Software diagnostics is rarely a straightforward process of extracting the list of diagnostic indicators from software execution artifacts. Usually, it involves artifact transformation through trace and log analysis patterns.
Consider a very large software log. Simple inspection if its trace messages may point to some problem patterns:
However, different log transformations via trace analysis patterns may reveal additional problem patterns:
We call such transformations Software Codiagnostics or Data Codiagnostics in general for pattern-oriented data analysis. The prefix co- signifies cooperative processes and also the fact that such transformations are dual (by analogy with dual categories in mathematics) to diagnostic processes especially when such transformations are reversible (or partially reversible):
Existential Prognostics: Periodic Table of Diagnostic Patterns
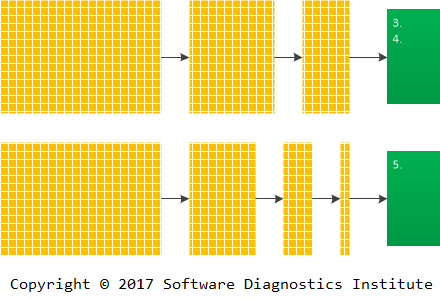
One of the features of the Periodic Table of Elements was the prediction of missing elements. In November 2010 we announced the discovery of the Periodic Table of Software Defects as “rules that make it possible to devise a memory dump and software trace analysis equivalent of the Periodic Table of Elements in Chemistry. It allows prediction of abnormal software behavior and structural defects and what patterns to look for after deploying software and collecting its artifacts”.
The publication of the second edition of Encyclopedia of Crash Dump Analysis Patterns makes it possible to see what patterns are expected in your favorite operating system and software product even if they have not been observed or cataloged yet (see its Table of Contents). This is why we call this type of prognostics existential as affirming or implying the existence of a diagnostic pattern, whether it is a problem pattern or problem analysis pattern.
As an example, we can tell the story of pattern prediction and discovery. An engineer expressed the doubt about the existence of Lateral Damage crash dump analysis pattern for Linux systems since he had never observed it during his diagnostic practice. Years passed, and it was recently observed and cataloged when analyzing Linux process core dumps.
Categorical Foundations of Software Diagnostics
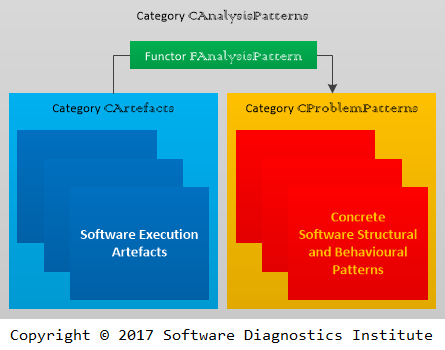
Since extracting information about behaviour from states is a coalgebra* (in our case, we have a behaviour functor from software execution artefacts such as memory snapshots and logs to diagnostic indicators that form concrete problem patterns) we decided to recast pattern-oriented software diagnostics in category theory language terms.
We introduce the following categories:
- Concrete Execution Artefacts: Category CArtefacts
Example: 3 memory dumps of Windows process with monotonically increasing size. 3 objects from CArtefacts category.
- Concrete Problem Patterns: Category CProblemPatterns
Example: 3 instances of monotonically increased Windows process heap allocations from specific modules.
- Concrete Analysis Pattern: Functor FAnalysisPattern
Example: Memory Leak (Process Heap, Windows) specifies the analysis process.
- Concrete Analysis Patterns: Category CAnalysisPatterns with natural transformations between functors.
Some functors may be similar, for example, Memory Leaks from different platforms. There exists a natural transformation between them. Such natural transformations are called General Analysis Patterns. They form a 2-category.
Some objects from CProblemPatterns may be similar. There exist “generalising” arrows between. The collection of such arrows forms a 2-category of General Problem Patterns.
This is a bottom-up approach. A top-down approach is possible when we start with general categories and select concrete subcategories inside. However, we think in the bottom-up approach general categories arise naturally and correspond to principles of pattern-based part of pattern-oriented diagnostics.
The following diagram illustrated concrete software diagnostics categories:
* Bart Jacobs, Introduction to Coalgebra: Towards Mathematics of States and Observation (ISBN: 978-1107177895)
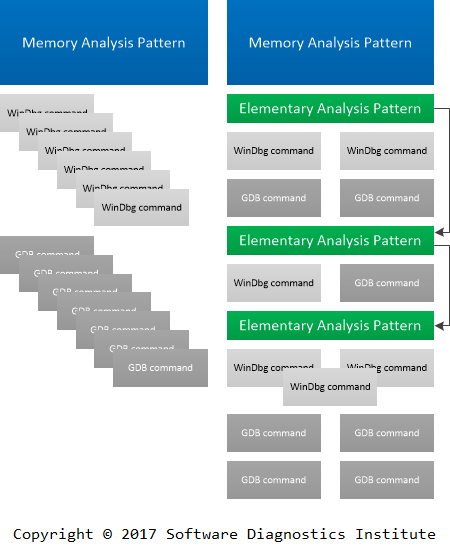
Reducing Analysis Pattern Complexity via Elementary Analysis Patterns
There are hundreds of debugger commands, such as commands from WinDbg, GDB, LLDB, and other debuggers. A typical diagnostic analysis pattern, for example, a memory dump analysis pattern, may involve many commands (Debugged! Magazine, March 2009). In November 2008 we proposed abstract debugging commands for common diagnostic, forensic, and debugging tasks. After the introduction of pattern-oriented diagnostic thinking we propose another analysis pattern abstraction level of Elementary Analysis Patterns that groups either real or abstract debugging commands and allows chaining analysis activities to uniformly describe diagnostic analysis patterns:
- Typical candidates include the following draft elementary analysis patterns for the new analysis pattern catalog:
- Setting Symbolic Information
- Listing Processes
- Setting Processes
- Listing Threads
- Setting Threads
- Listing Modules
- Listing Memory Regions
- Dumping Memory
- Listing Object Names
- Counting Objects
- Dumping Object State
- Checking Instrumentation
- Listing Heaps
- Listing Heap Entries
- Listing Stack Traces
- Listing CPUs
- Dumping Thread State
- Searching Memory
- ...
Some Elementary Analysis Patterns may correspond to a single WinDbg command, and some may group several debugger commands. The exact names will be incrementally added and incrementally refined over the course of catalog building process.
Some Elementary Analysis Patterns may be reused across different analysis pattern catalogs, for example, Setting Symbolic Information is also applicable to trace and log analysis, for example, Windows ETW traces (see No Trace Metafile analysis pattern) and Fiber Bundle analysis pattern where symbols are needed for associated stack traces or Adjoint Space where symbols are needed for associated memory snapshots.
Such analysis patterns are different from Elementary Software Diagnostics Patterns since the latter are about observed behavioral signs, but the former are about the analysis process.
Let’s look at one example. We observe increasing memory Counter Values for one Windows server process and look at its memory snapshots. The process doesn’t use .NET so we use process heap Memory Leak analysis pattern which can be split into the following sequentially applied Elementary Analysis Patterns that group appropriate WinDbg commands:
- Setting Symbols (.symfix, .sympath+)
- Checking Instrumentation (!gflag)
- Listing Heaps (!heap -s)
- Listing Heap Entries (!heap -k -h)
In the case of missing user mode stack trace database or before asking for it, we can also use the following Elementary Analysis Patterns for symbolic hints such as Module Hint analysis pattern, ASCII, and UNICODE data:
- Dumping Memory (dc, dps, dpS, dpa, dpu) for heap entries
- Searching Memory (s-sa, s-su) for heap entries
All these provide a better description of analysis patterns. The same approach can be applied to trace and log analysis including network trace analysis, memory forensics, reversing and malware analysis.
Principles of Pattern-Oriented Software Data Analysis
2016 is closing, and for 2017 we look forward to applying software diagnostics and software post-construction problem-solving insights gained over the 10 years of Software Diagnostics Institute research to software data analysis in general. In addition to memory snapshots (Dump Artefacts) and logs (Trace Artefacts) and their analysis that we abbreviated as DA+TA, we extend our pattern-oriented approach to additional artifacts as security data, source code, configuration data, telemetry, revision repositories, and stores. We consider all additional software data types as examples of generalized software narratives and traces and abbreviate as simply DATA.
It is time to bring together the principles of pattern-oriented data analysis:
1. Patterns-based
Data patterns and data analysis patterns are classified into catalogs and named to form pattern languages. Every major kind of software data and activity associated with its data analysis can have its own pattern language and catalog. Pattern catalogs are dynamic structures. New patterns are added, old are revised. New catalogs are refined, added, or combined. Pattern names change if necessary to accommodate new data meta-analysis insights (Pattern-Based Software Diagnostics). Patterns can be reused across different data domains.
2. Patterns-driven
Data patterns that are diagnosed using data analysis patterns that are guided by meta-patterns trigger appropriate actionable decisions (Pattern-Driven Software Diagnostics).
3. Systemic-based
Data analysis is a multidisciplinary activity incorporating insights from natural and medical sciences, humanities and social sciences (Systemic Software Diagnostics).
4. Mechanisms-based
The pattern-oriented data analysis may lead to data root cause analysis when coupled with mechanisms.
5. Narrative-based
Software data is a form of a software narrative including data analysis itself (the higher-order narrative analysis).
6. Pattern square-based
There are special and general data patterns and special and general data analysis patterns (Pattern Square).
7. Patterns-assisted
Since software usage is a human activity, software data analysis should be human-assisted. Data analysis patterns facilitate data analysis verifiability, elimination of data analysis errors, and provide independence of data analysis reporting from idiosyncratic data analysis habits*. Software data and data analysis patterns and their languages assist humans in achieving and maintaining software data analysis quality.
* B. Russo, The need for data analysis patterns (in software engineering), Perspectives on Data Science for Software Engineering (ISBN: 978-0128042069)
Pattern-Oriented Diagnostic Analysis Process
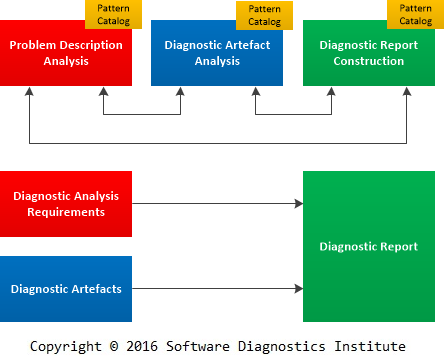
Previously we introduced Pattern-Oriented Debugging Process where software diagnostics played the major role as a part of debugging. However, in the case of a separate software diagnostic process, we introduce Pattern-Oriented Diagnostic Analysis Process, that incorporates diagnostic analysis requirements elicitation from problem description analysis and diagnostic report construction. Both new additions require separate pattern catalogs. Problem description analysis pattern catalog is already being extended, and the new catalog for diagnostic report construction is under development and will be published soon. The central process part, diagnostic artifact analysis, already has two extensive analysis pattern catalogs for software log analysis and memory analysis. The process is illustrated in the following diagram:
Software Diagnostic Space as a General Graph of Software Narratives
By connecting various memory spaces (user, kernel, physical, virtual, orbifold, manifold, fiber bundle, adjoint), trace and log spaces, and problem description narratives we introduce Software Diagnostics Space as a search space for finding problem patterns using general and concrete analysis patterns. Using mathematical metaphors we view it as a general graph of statements from Software Problem Narrative (graph vertices) and various software narratives such as logs, traces and memory spaces (edges). Software problem narratives may be different from software problem descriptions (which we get from software users and which have their own analysis patterns) because they are controlled narratives of actor interactions while working with software (top right corner of software narratology square). For completeness, every software narrative edge has vertices by default as start and stop vertices.
We consider Software Diagnostic Space as Trace Mask of Software Problem Narrative with Special and General Traces and Logs.
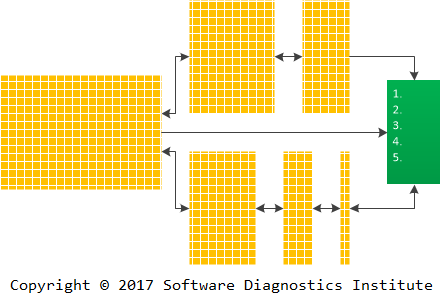
Let’s look at one example depicted in the following diagram:
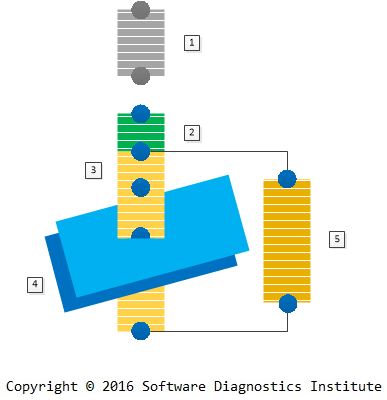
We have the problem description from a user who couldn’t exercise some software functionality unless some service was restarted. This is a problem description narrative (no. 1). A software support person constructed the problem reproduction setup narrative (no. 2) and recorded problem narrative no. 3 – 5 with tracing the client and server software and taking memory snapshots (Adjoint Space trace and log analysis pattern) of the corresponding service and another Coupled Process (memory analysis pattern).
This can all be depicted in the following general graph (multigraph) diagram where loops show adjoint spaces (“instantaneous” artifact snapshots like memory, data):
Such graphs may not be connected, and loops may be replaced by additional multiple edges with extra vertices.
The practical usage of such graphs can be demonstrated by their construction during problem analysis. Suppose that we have a problem description:
After its analysis we construct a problem narrative:
During its trace analysis we identify needed software trace edges:
We add multiple edges if tracing involves several software systems or different trace varieties:
Topological Software Trace and Log Analysis
Previously we based software trace and log analysis on software narratology. While continuing further research and development in that direction we are now constructing a new software trace and log analysis system called TopoLog based on ideas and techniques from topology (originally called analysis situs in Latin: analysis of the situation) as a part of theoretical software diagnostics. Over the years we described a few trace and log analysis patterns based on topological metaphors: Quotient Trace, Message Cover, Fiber Bundle, Sheaf of Activities, and Adjoint Space. Before starting our pattern work on software trace analysis we considered threads as braids in abstract space, and, after the first analysis patterns, we considered multithreading as multibraiding. For general software traces and logs including memory snapshots we propose topological state analysis, for example, analysis of the covering space via open and closed Memory Regions and Region Strata.
Memory Dump Analysis Anthology, Volume 9b
The following direct links can be used to order the book now:
Buy Paperback or Kindle from Amazon
Buy Paperback from Barnes & Noble
Buy Paperback from Book Depository
Also available in PDF format from Software Diagnostics Services
Contains revised, edited, cross-referenced, and thematically organized selected articles from Software Diagnostics Institute (DumpAnalysis.org + TraceAnalysis.org) and Software Diagnostics Library (former Crash Dump Analysis blog, DumpAnalysis.org/blog) about software diagnostics, root cause analysis, debugging, crash and hang dump analysis, software trace and log analysis written in March - September 2016 for software engineers developing and maintaining products on Windows platforms, quality assurance engineers testing software, technical support and escalation engineers dealing with complex software issues, security researchers, reverse engineers, malware and memory forensics analysts. This volume is fully cross-referenced with volumes 1 – 9a and features:
- 11 new crash dump analysis patterns
- 11 new software log and trace analysis patterns
- New structural memory pattern
- Introduction to Riemann root cause analysis language
- Introduction to problem solving as code
- Introduction to Dia|gram graphical diagnostic analysis language
- Introduction to iterative pattern-oriented root cause analysis
- Definition of theoretical software diagnostics
Product information:
- Title: Memory Dump Analysis Anthology, Volume 9b
- Authors: Dmitry Vostokov, Software Diagnostics Institute
- Language: English
- Product Dimensions: 22.86 x 15.24
- Paperback: 149 pages
- Publisher: OpenTask (October 2016)
- ISBN-13: 978-1-908043-36-8

Theoretical Software Diagnostics and Education
After writing so much about software diagnostics, we introduce its abstract generalising principles of pattern orientation and systems thinking as Theory of Software Diagnostics. We were thinking about the importance of theory for quite some time until we got acquainted with the work of Leo Klejn who coined a term “theoretical archaeology.” Then we also decided to coin the similar term for software meta-diagnostics since we compiled two books as guides to software diagnostics principles irrespective of software platforms, vendors, and their software products: Software Diagnostics and Principles of Memory Dump Analysis and plan to publish a compilation of related theoretical articles (Theoretical Software Diagnostics, ISBN-13: 978-1-908043-98-6, forthcoming September 2016). Looking for the development of theoretical archaeology as guidance makes sense because it emerged recently in contemporary times and also deals with artefacts, historical reconstruction, and time- and memory-related issues, albeit of a different nature. While working on theoretical foundations and principles for many years, we had to learn theories, ideas, and metaphors of other disciplines used in software diagnostics that we call software para-diagnostic theories by analogy with para-archaeological (coined by Klejn) theories such as history, sociology, linguistics. In his book Introduction to Theoretical Archaeology: Meta-archaeology, Klejn made a few remarks on the required theoretical education. We would like to reformulate them in relation to theoretical software diagnostics:
- Very few people do theory because theoretical thinking requires broad education and polymath knowledge across many disciplines. We found that:
- Computer science and software engineering education helps in the practical side of software diagnostics but is not enough;
- Knowledge of university-level mathematics and natural science education help in understanding of technical diagnostics but is not enough;
- Knowledge of the principles of medical diagnostics helps because pattern-oriented facet of theoretical software diagnostics is partially based on medical metaphors;
- Knowledge of semiotics helps in understanding of the role of signs in theoretical software diagnostics;
- Knowledge of philosophy helps in deeper understanding of foundational aspects of theoretical software diagnostics such as the nature of problems, their phenomenology, meaning, and understanding;
- Humanities education (analysis of human-made artefacts) is very important since software diagnostics is also based on artefact analysis.
- Such education is needed from earlier up and in addition to computers and coding should also include history, philology, narratology, and literary theory.
- In summary, broad reading is required to get acquainted with diagnostics expertise in various domains of human activity.
Iterative Pattern-Oriented Root Cause Analysis
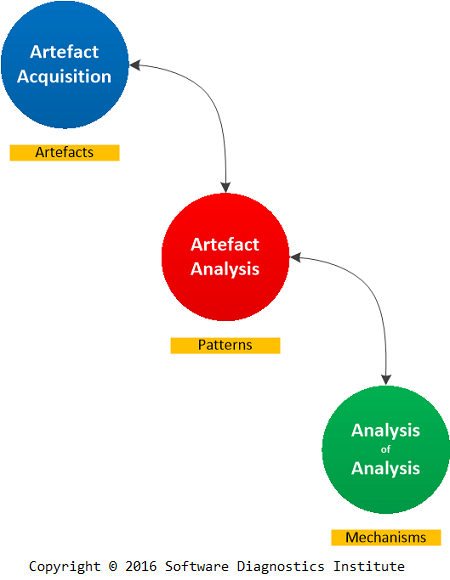
When we introduced A.P.M. patterns-based root cause analysis methodology (Artefacts. Patterns. Mechanisms.), it may have made an impression of a waterfall-type process with some iterations between artefact collection and diagnostic analysis when collected artefacts are not good. However, software post-construction problem solving is usually iterative, with memory dumps and software logs collected again and again after the preliminary root cause analysis.
To illustrate the iterative nature of the process we first name its stages as Artefact Acquisition for Artefacts, Artefact Analysis for Patterns (diagnostics), and Analysis of Analysis for Mechanisms (root cause analysis):
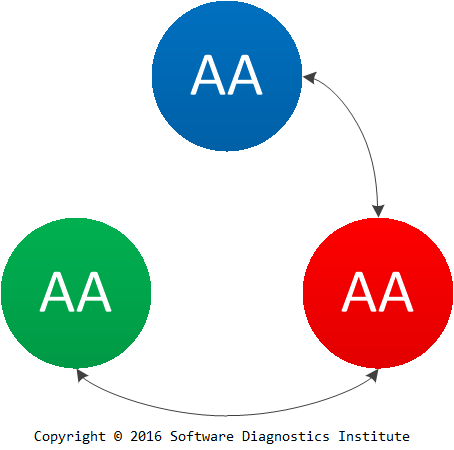
Now we rearrange these AA stages:
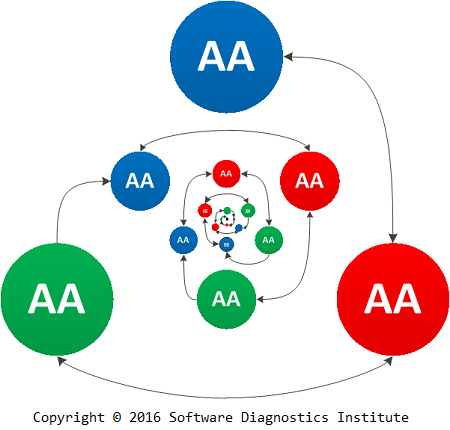
After the preliminary root cause analysis (Analysis of Analysis) we may need to gather more artefacts for further diagnostics and more precise RCA, and this is reflected in more focused stages:
Problem Solving as Code
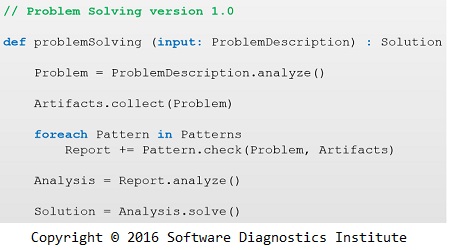
We introduce Problem Solving as Code as a process of developing, managing, and provisioning problem-solving methods and tools. Some problem-solving methodologies such pattern-oriented problem solving developed by Software Diagnostics Institute as a part of Diagnostics Science require constantly evolving pattern catalogues which can be stored in version control systems. For example, pattern-oriented software problem solving involves pattern-oriented problem description analysis and software execution memory and trace artefact acquisition, pattern-driven and pattern-based software diagnostics (including
Dia|gram Graphical Diagnostic Analysis Language
![]()
One of the current Software Diagnostics Institute projects is the development of Dia|gram graphical language for pattern-oriented software diagnostics, forensics, prognostics, root cause analysis and debugging. It combines the best features from:
- Visual Dump Objects: Graphical Notation for Memory Dumps;
- STDiagrams: Software Trace Diagrams;
- Visual compression of software traces and logs (including “bird’s eye view” of software traces), first introduced in Characteristic Message Block trace and log analysis pattern;
- Minimal Trace Graphs, first introduced in Activity Region trace and log analysis pattern. Numerous examples can be found in Accelerated Windows Software Trace Analysis training course reference and Software Trace and Log Analysis: A Pattern Reference book;
- Minimal Stack Trace Diagrams, first introduced in Constant Subtrace memory analysis pattern.
The purpose of Dia|gram language is twofold:
- To provide a succinct presentation and visualization of software execution state, artefacts, distribution of problem patterns, problem analysis patterns and their relationship;
- To communicate pattern-oriented software diagnostic analysis results.
Additionally, Dia|gram may be used for presentation and analysis of higher-order pattern narratives.
Software Diagnostics Institute also proposes the UML profile for Software Diagnostics with additional diagram types: artefact acquisition map, activity backtrace, and implementation internals. This work is only started, and more will be presented in subsequent articles.
Software Diagnostics Services plans to include Dia|gram in its forthcoming Advanced Software Trace and Log Analysis training course.
Riemann Root Cause Analysis Pattern Language

Image generated by 3D-XplorMath
Incepted and named in February 2009 shortly before the first software trace and log analysis pattern was published in April the same year, Riemann Programming Language was thought of as a software problem description language capable of generating software problem-solving tools (including TaaS version). A book was planned for publication in 2010: The Riemann Programming Language (ISBN: 978-1906717605). The main motivation at that time for the name was the metaphorical correspondence between multi-valued functions represented by Riemann surfaces and software defects as alternative branches of computation. Since the significant development of pattern-oriented software diagnostics, introduction of network and performance analysis pattern languages and patterns-based root cause analysis methodology we now make Riemann Programming Language an optional coding complement to Riemann Root Cause Analysis Pattern Language. The latter includes diagnostic analysis pattern languages for trace analysis and memory analysis developed by Software Diagnostics Institute including structural memory patterns in the context of general log analysis. We can now consider another analogy with multi-valued functions where the same general diagnostic patterns in a memory dump or log can be generated by different source code. Riemann RCA Pattern Language facilitates the transformation of software narrative artefacts into much shorter analysis narratives through the process of articoding. The resulting analysis artefacts can be programmatically processed to generate diagnostic, troubleshooting and debugging configurations, classes and functions, frameworks and plugins, components and nodes. The following diagram describes this process:

The Riemann programming language should not be confused with Riemann monitoring system which was named and developed later elsewhere by a different group of people and which is about collecting events and not about their collective analysis using pattern-oriented analysis methodology developed by Software Diagnostics Institute. Regarding event monitoring, Software Diagnostics Institute also develops platform-independent software trace and log acquisition patterns for better use of various monitoring systems.
Diagnostics of Things (DoT)
![]()
We introduced Narratology of Things as a combination of Software Narratology of Things and Hardware Narratology. Since memory dump analysis may be considered as a part of general trace and log analysis we open a new research direction for Diagnostics of Things (DoT) based on Narratology of Things and Pattern-Oriented Trace and Log Analysis, which also includes software execution artifacts of things and pattern-oriented network trace analysis from IoT.
Memory Dump Analysis Anthology, Volume 9a
The following direct links can be used to order the book now:
Buy Kindle version
Buy Paperback from Amazon
Buy Paperback from Barnes & Noble
Buy Paperback from Book Depository
Also available in PDF format from Software Diagnostics Services
Contains revised, edited, cross-referenced, and thematically organized selected articles from Software Diagnostics Institute (DumpAnalysis.org + TraceAnalysis.org) and Software Diagnostics Library (former Crash Dump Analysis blog, DumpAnalysis.org/blog) about software diagnostics, root cause analysis, debugging, crash and hang dump analysis, software trace and log analysis written in August 2015 - February 2016 for software engineers developing and maintaining products on Windows platforms, quality assurance engineers testing software, technical support and escalation engineers dealing with complex software issues, security researchers, reverse engineers, malware and memory forensics analysts. This volume is fully cross-referenced with volumes 1 – 8 and features:
- 9 new crash dump analysis patterns
- 9 new software log and trace analysis patterns
- 15 Linux core dump analysis pattern variants
- New workaround pattern
- New memory dump analysis case study
- Introduction to pattern-oriented software internals, pattern paradigms, pattern stacks, pattern repertoire
- Introduction to software diagnostics canvas
- Introduction to patterns-based root cause analysis methodology
- Introduction to a protein metaphor for software traces and logs
- Definition of software diagnostics scope
- Introduction to artificial debugger and pseudo-memory dumps
- Definition of tool-centric and pattern-centric software diagnostics, forensics, prognostics
Product information:
- Title: Memory Dump Analysis Anthology, Volume 9a
- Authors: Dmitry Vostokov, Software Diagnostics Institute
- Language: English
- Product Dimensions: 22.86 x 15.24
- Paperback: 179 pages
- Publisher: OpenTask (February 2016)
- ISBN-13: 978-1-908043-35-1

The Scope of Software Diagnostics
Should software diagnostics stand alone as a separate, distinct diagnostics or be a part of some other diagnostics? We considered initially 3 types of diagnostics: medical, technical, and software:
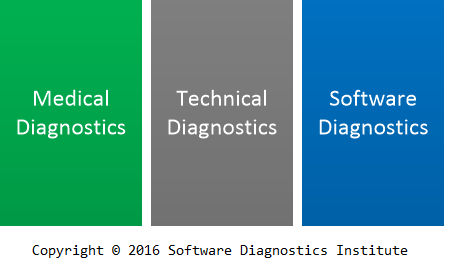
The objects of medical diagnostics are obviously humans and mostly their biological artefacts (we say mostly because linguistic and textual artifacts can also be used for diagnosis). The objects of technical diagnostics are structures and systems made from natural and artificial organic and inorganic engineering materials (Handbook of Technical Diagnostics: Fundamentals and Application to Structures and Systems, ISBN: 978-3642258497, pp. 11 – 16). The objects of software diagnostics are obviously software systems.
We define software diagnostics as “a discipline studying abnormal software structure and behavior in software execution artefacts (such as memory dumps, software and network traces and logs)” (Introduction to Philosophy of Software Diagnostics, Part 1, page 7) or, more generally, to include the context of forensics as “a discipline studying signs of software structure and behavior in software execution artefacts (such as memory dumps, software and network traces and logs)” (Pattern-Oriented Software Forensics: A Foundation of Memory Forensics and Forensics of Things, page 18).
Although, there are many conceptual similarities in general between these diagnostics, there are three features of software that set software diagnostics apart:
- A software system or its artefact can be copied.
- The software can be its own model. This follows from the previous feature since we can copy the software execution state and then study the effects of its execution independently. However, it is possible to have different software models for diagnostics as, for example, in Projective Debugging.
- Software execution artefacts are both symbolic and digital.
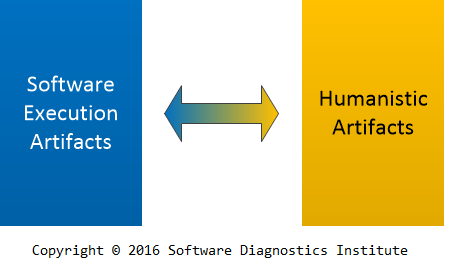
There are also humanistic artefacts (A New History of the Humanities: The Search for Principles and Patterns from Antiquity to the Present, ISBN: 978-0199665211) such text (including historical documents), language, literature, and music which are symbolic and digital or can be digitised. Diagnostics takes the form of literary criticism and text reconstruction (philology). Many similarities there gave rise to Software Narratology and Systemic Software Diagnostics:
Teaching Complex Diagnostic Scenarios with Artificial Debugger (ArtDbg) and Pseudo-Memory Dumps
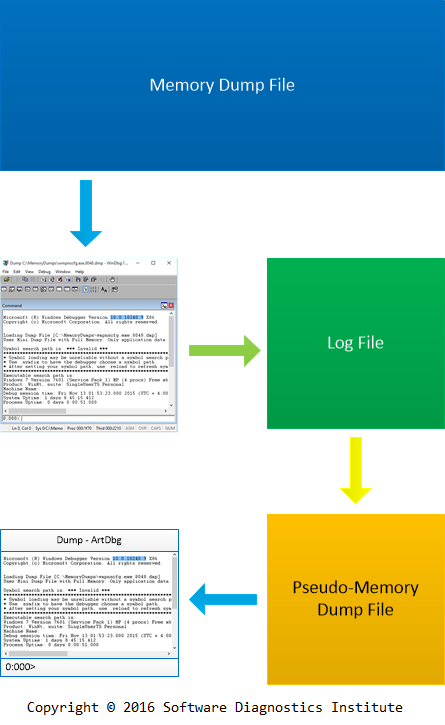
One of the problems in teaching software diagnostics and postmortem debugging is a simulation of complex software problem scenarios. There are plenty of real life memory dumps available but due to security considerations they cannot be shared outside of the organisation. Here we introduce Artificial Debugger project (ArtDbg) that simulates the I/O of the real debugger, for example, WinDbg, GDB, or LLDB.
The real memory dump is analyzed in the real debugger, and all debugger input and output is saved in a log file. This log file is then scanned for any potentially sensitive information, and all such information is eliminated (Security Problem, Memory Dump Analysis Anthology, Volume 1, page 224). It is then converted into a binary pseudo-memory dump format.
ArtDbg is used to open and analyze such pseudo-memory dumps. It allows using the same real debugger commands that were used to generate the log file. Such commands will output the same information that was available from the real debugger. Some real debugger commands that were not used to generate the log file may also be used if possible.
Software Diagnostics Services plans to use the first version of ArtDbg in their new version of Accelerated Windows Memory Dump Analysis training scheduled in March 2016 to teach some very complex enterprise diagnostic scenarios in addition to WinDbg exercises with real memory dumps.